which is the graph of the linear inequality y < 3x + 1?
which is the graph of the linear inequality y < 3x + 1?
Answer
Answer:
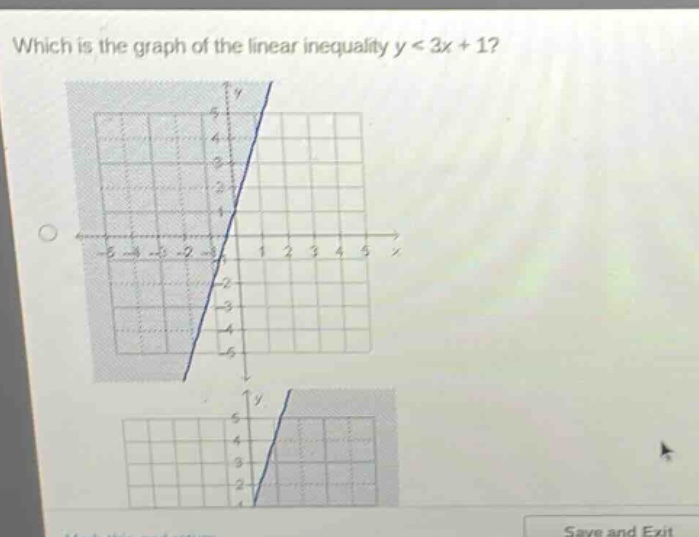
To graph the linear inequality (y < 3x + 1), first graph the line (y=3x + 1). The slope of the line is (m = 3) and the y - intercept is (b = 1).
- Plot the y - intercept: The y - intercept is the point ((0,1)). Mark this point on the coordinate plane.
- Use the slope to find another point: The slope (m = 3=\frac{3}{1}). From the point ((0,1)), move 1 unit to the right and 3 units up to get the point ((1,4)). Draw a dashed line through these two points because the inequality is (y<3x + 1) (not (y\leqslant3x + 1), so the points on the line are not part of the solution set).
- Test a point: Choose a test - point not on the line, say ((0,0)). Substitute (x = 0) and (y = 0) into the inequality (y<3x + 1). We get (0<3(0)+1), or (0 < 1), which is a true statement. So, shade the region that contains the point ((0,0)).
The region below the dashed line (y = 3x+1) is the graph of the inequality (y < 3x + 1).
Explanation:
Step1: Plot y - intercept
Plot point ((0,1)) as (b = 1) in (y=mx + b).
Step2: Use slope to find another point
From ((0,1)), move 1 right, 3 up to ((1,4)) as (m = 3).
Step3: Draw the line
Draw a dashed line through ((0,1)) and ((1,4)) for (y<3x + 1).
Step4: Test a point
Test ((0,0)) in (y<3x + 1). Since (0<1) (true), shade region with ((0,0)).