which is the graph of the linear inequality $\frac{1}{2}x - 2y > -6$?
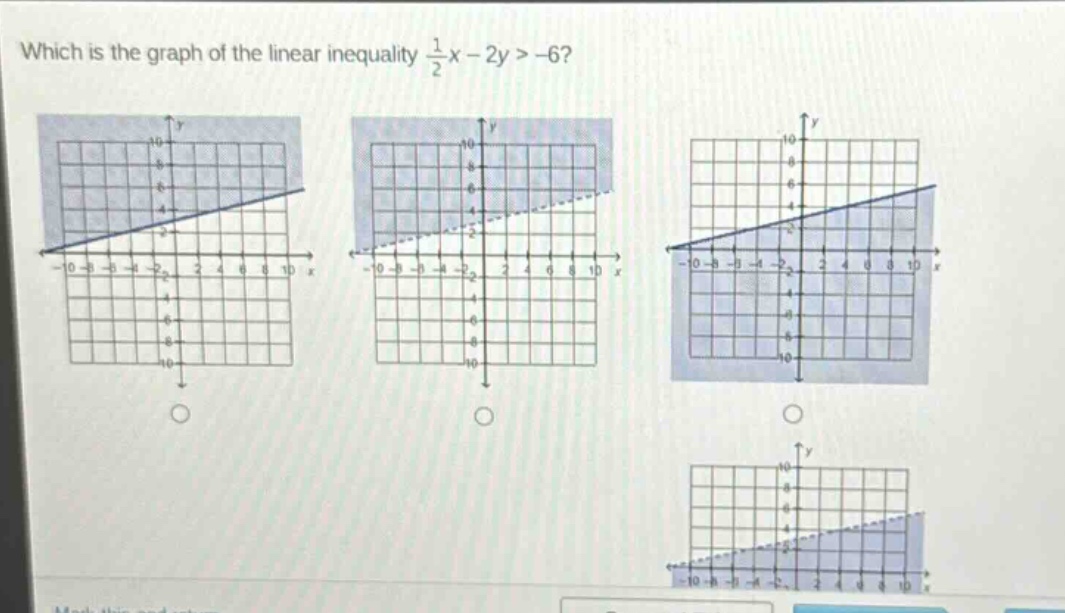
which is the graph of the linear inequality $\frac{1}{2}x - 2y > -6$?
Answer
Explanation:
Step1: Rewrite the inequality in slope - intercept form
First, start with $\frac{1}{2}x−2y > - 6$. Subtract $\frac{1}{2}x$ from both sides: $-2y>-\frac{1}{2}x - 6$. Then divide each term by $- 2$. When dividing an inequality by a negative number, the direction of the inequality sign changes. So we get $y<\frac{1}{4}x + 3$.
Step2: Analyze the boundary line and shading
The boundary line of the inequality $y<\frac{1}{4}x + 3$ is the equation $y = \frac{1}{4}x+3$. Since the inequality is $y<\frac{1}{4}x + 3$, the boundary line is a dashed line (because the points on the line are not included in the solution set). Also, we shade the region below the line because we want all the $y$ - values that are less than $\frac{1}{4}x + 3$.
The graph with a dashed line having a slope of $\frac{1}{4}$ and $y$ - intercept of 3 and shading below the line is the correct one.
Answer:
The graph with a dashed line and shading below the line $y=\frac{1}{4}x + 3$ (you need to visually identify this among the given graphs).