which is the graph of a logarithmic function?
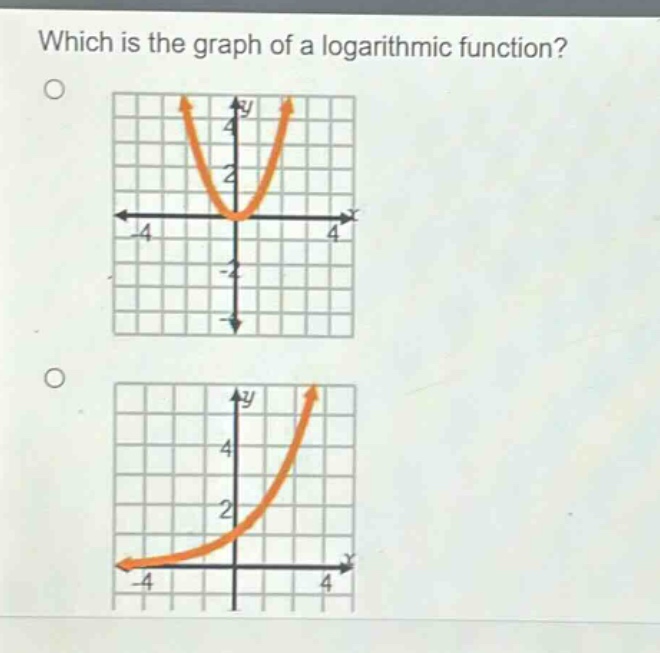
which is the graph of a logarithmic function?
Answer
Brief Explanations:
A logarithmic function (y = \log_a(x)) ((a>0,a\neq1)) has a vertical - asymptote at (x = 0), and its domain is (x>0). The graph of a logarithmic function is a curve that increases (for (a > 1)) or decreases (for (0 < a<1)) as (x) moves from left - to - right for (x>0). The first graph is a parabola (a quadratic function), while the second graph has the general shape of a logarithmic function with a vertical asymptote at (x = 0) and increasing as (x) increases.
Answer:
The second graph.