which graph could model the path of a pendant attached to the outer edge of a wheel rim with a 7 - inch…
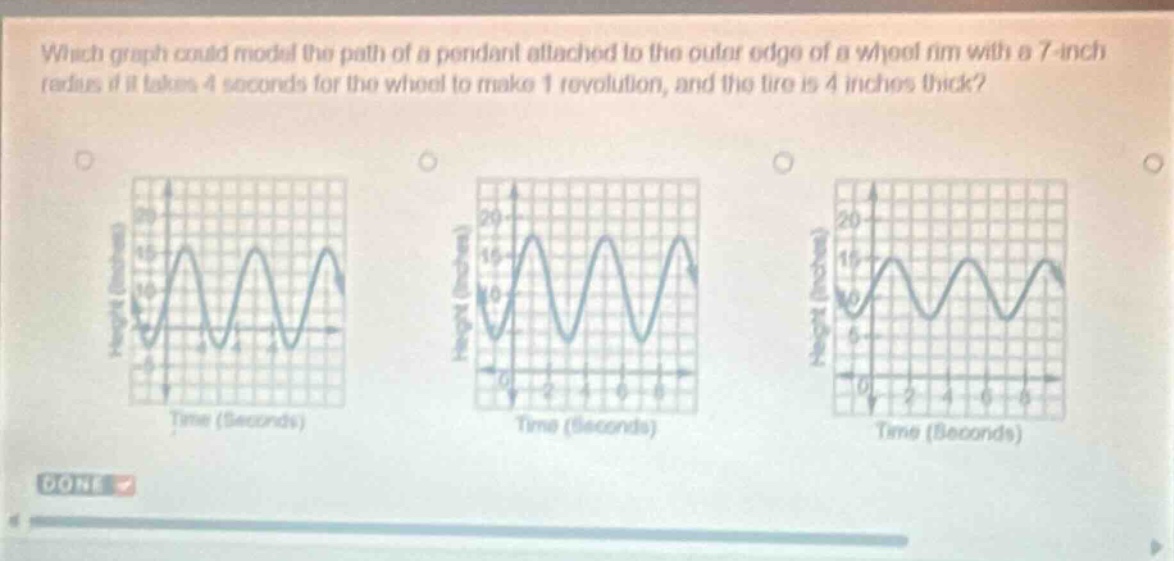
which graph could model the path of a pendant attached to the outer edge of a wheel rim with a 7 - inch radius if it takes 4 seconds for the wheel to make 1 revolution, and the tire is 4 inches thick?
Answer
Answer:
We need to analyze the characteristics of the motion to determine the correct graph. The motion of the pendant attached to the outer - edge of the wheel is a periodic motion. The period (T) of the motion is the time it takes for the wheel to make 1 revolution. Here, (T = 4) seconds.
The radius of the wheel rim is (r=7) inches and the tire is (4) inches thick. The amplitude (A) of the vertical displacement of the pendant (assuming a vertical - axis for height) is the sum of the radius of the rim and the thickness of the tire, so (A=7 + 4=11) inches.
A periodic function that models the height of the pendant as a function of time (t) is a sinusoidal function of the form (y = A\sin\left(\frac{2\pi}{T}t\right)+k) (assuming the mid - height is (k)).
Let's analyze each graph:
- Amplitude: The amplitude is the maximum distance from the mid - line of the graph to its peak or trough. We expect an amplitude of (11) inches.
- Period: The period is the time it takes for the graph to complete one full cycle. We expect a period of (T = 4) seconds.
Looking at the graphs, we need to find the one with an amplitude of (11) inches and a period of (4) seconds.
If we assume the mid - height of the pendant's motion is at some reference level, and we know that the general form of a sine function for this periodic motion is (y=A\sin\left(\omega t\right)+h) where (\omega=\frac{2\pi}{T}) and (T = 4) seconds so (\omega=\frac{\pi}{2}) radians per second and (A = 11) inches.
The graph that has a period of (4) seconds (the time between two consecutive peaks or troughs is (4) seconds) and an amplitude such that the maximum and minimum values are (11) units away from the mid - line is the correct one.
Without seeing the specific details of the graphs in a numbered or labeled way, we can't directly point out which one it is, but the steps to identify it are as above. If we assume the graphs are labeled as Graph A, Graph B, Graph C:
- Check the period of each graph by measuring the time between two consecutive peaks or troughs. It should be (4) seconds.
- Check the amplitude of each graph by measuring the vertical distance from the mid - line to a peak or trough. It should be (11) inches.
The graph that satisfies both these conditions is the correct model for the path of the pendant.
Explanation:
Step1: Calculate the amplitude
The amplitude (A) is the sum of the radius of the rim and the thickness of the tire. (A=7 + 4=11) inches.
Step2: Determine the period
The period (T) is the time for one revolution. Given (T = 4) seconds.
Step3: Analyze the graphs
Check each graph for the correct amplitude and period.