the graph is the path beth took on a walk. what does the line from time 6 to 10 indicate? beth slowed down…
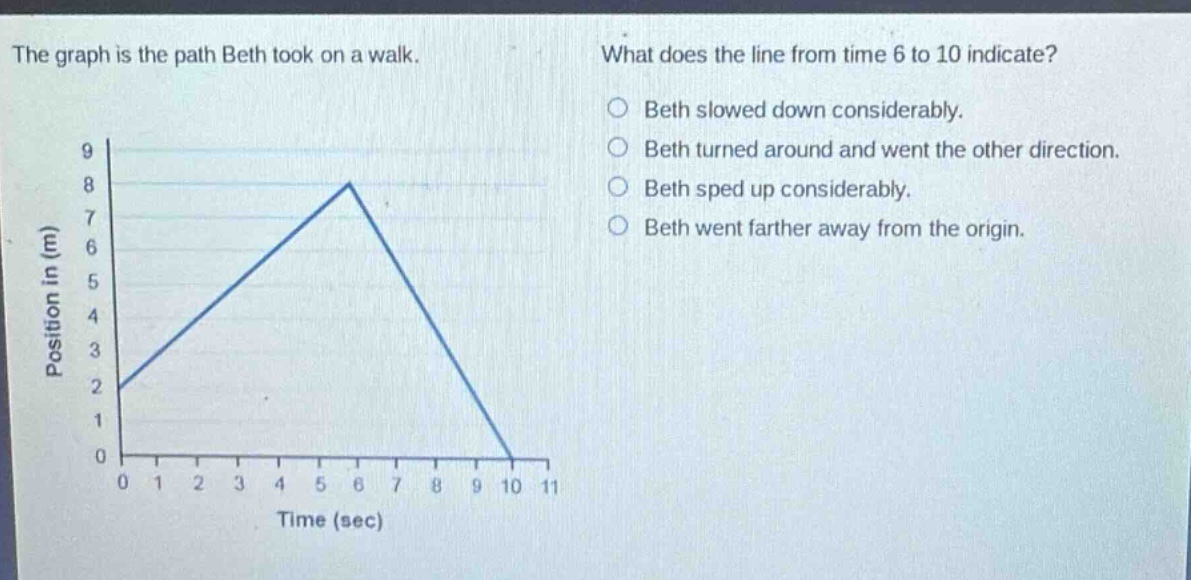
the graph is the path beth took on a walk. what does the line from time 6 to 10 indicate? beth slowed down considerably. beth turned around and went the other direction. beth sped up considerably. beth went farther away from the origin. position in (m) 9 8 7 6 5 4 3 2 1 0 0 1 2 3 4 5 6 7 8 9 10 11 time (sec)
Answer
Brief Explanations:
In a position - time graph, the slope represents velocity. From time 6 to 10, the position is decreasing. A decreasing position means the object is moving back towards the origin, which implies a change in direction.
Answer:
Beth turned around and went the other direction.