which graph represents y = -2x?
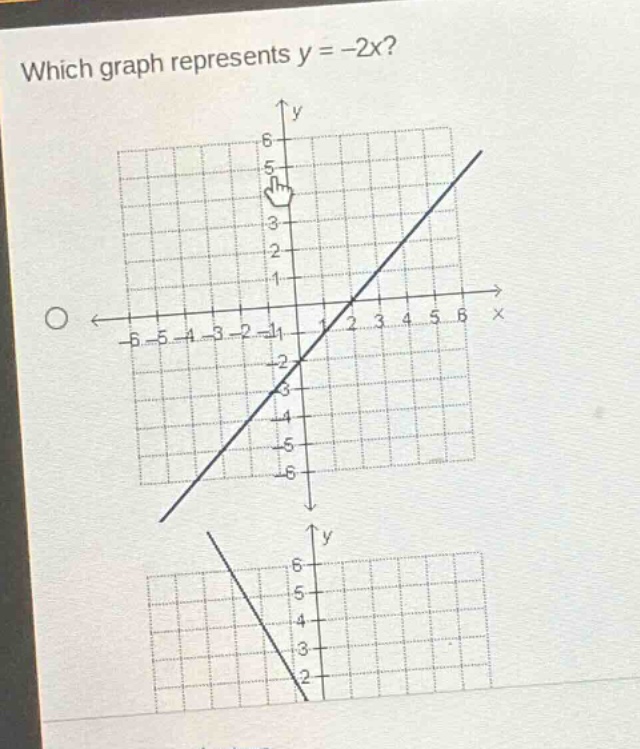
which graph represents y = -2x?
Answer
Explanation:
Step1: Identify the slope - intercept form
The equation $y = - 2x$ is in the form $y=mx + b$, where $m$ is the slope and $b$ is the y - intercept. Here, $m=-2$ and $b = 0$.
Step2: Analyze the slope and y - intercept
A slope of $m=-2$ means for every 1 unit increase in $x$, $y$ decreases by 2 units. A y - intercept of $b = 0$ means the line passes through the origin $(0,0)$.
Step3: Check the graphs
We look for a line that passes through the origin and has a negative slope (goes down from left to right).
Answer:
The graph with a line passing through the origin $(0,0)$ and having a negative slope (going down from left to right) represents $y=-2x$. Without specific labels for the two graphs, we can't point out which one exactly among the two given, but it should be the one with a negative - sloped line through the origin.