which graph represents the compound inequality? -3 < n < 1
which graph represents the compound inequality? -3 < n < 1
Answer
Answer:
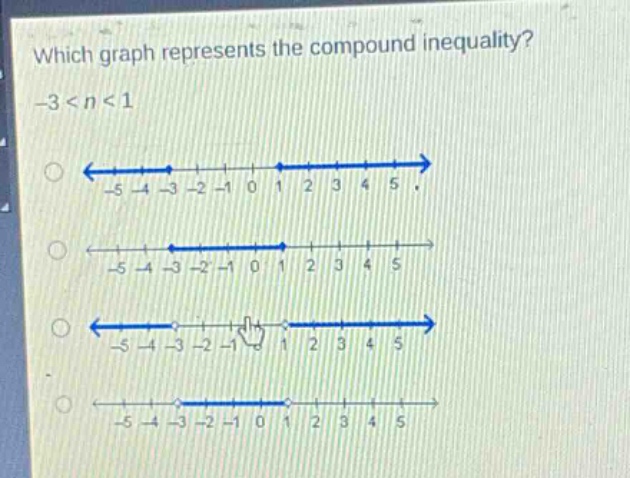
The fourth graph (the one with an open - circle at - 3, an open - circle at 1, and the line segment between them).
Explanation:
Step1: Analyze the inequality
The compound inequality $-3 < n<1$ means $n$ is greater than - 3 and less than 1.
Step2: Understand graphing rules
For $n > - 3$, we use an open - circle at - 3 (since $n$ is not equal to - 3) and shade to the right. For $n < 1$, we use an open - circle at 1 (since $n$ is not equal to 1) and shade to the left. The intersection of these two conditions is the line segment between - 3 and 1 with open - circles at both endpoints.