which graph represents the compound inequality? h ≥ -5 and h < 2
which graph represents the compound inequality? h ≥ -5 and h < 2
Answer
Answer:
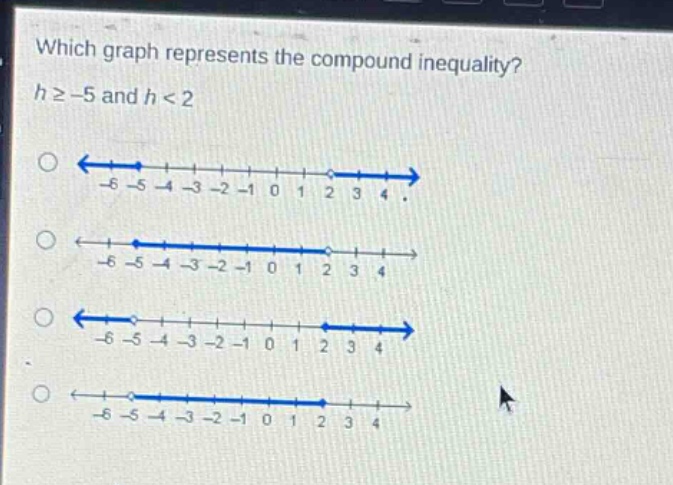
The second - option (the one with a closed circle at - 5 and an open circle at 2 with the line segment in between).
Explanation:
Step1: Analyze $h\geq - 5$
A closed circle is used at $h = - 5$ on the number - line since the inequality includes equality.
Step2: Analyze $h\lt2$
An open circle is used at $h = 2$ on the number - line since the inequality is strict.
Step3: Determine the solution set
The solution set is all values of $h$ that satisfy both inequalities, which is the set of numbers between - 5 (inclusive) and 2 (exclusive), represented by a line segment connecting the closed circle at - 5 and the open circle at 2.