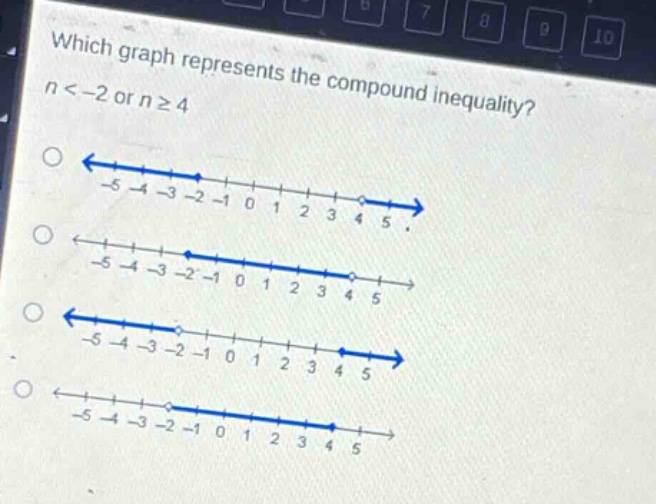
which graph represents the compound inequality? n < -2 or n ≥ 4
which graph represents the compound inequality? n < -2 or n ≥ 4
Answer
Answer:
The third option (the one with an open - circle at - 2 and an arrow pointing left, and a closed - circle at 4 and an arrow pointing right).
Explanation:
Step1: Analyze (n < - 2)
For (n < - 2), we use an open - circle at (-2) (since (-2) is not included) and an arrow pointing to the left on the number line.
Step2: Analyze (n\geq4)
For (n\geq4), we use a closed - circle at (4) (since (4) is included) and an arrow pointing to the right on the number line.
Step3: Combine the two
The compound inequality (n < - 2) or (n\geq4) is represented by the graph with an open - circle at (-2) and arrow left, and a closed - circle at (4) and arrow right.