which graph represents the compound inequality?\n$-3 < n < 1$
which graph represents the compound inequality?\n$-3 < n < 1$
Answer
Explanation:
Step1: Identify the inequality boundaries
The compound inequality is $-3 < n < 1$, meaning $n$ is between $-3$ and $1$.
Step2: Determine the circle types
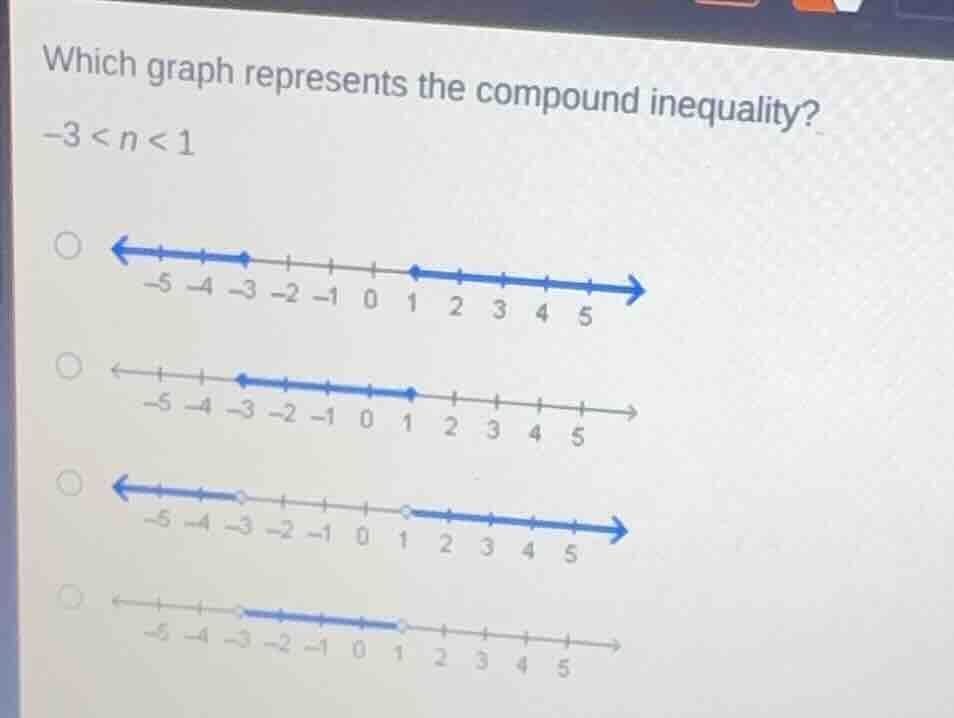
Since the symbols are strictly "less than" ($<$), use open circles at $-3$ and $1$.
Step3: Determine the shaded region
The inequality represents values between the boundaries, so shade the segment between $-3$ and $1$.
Answer:
The fourth option: A number line with open circles at -3 and 1, with the segment between them shaded.