the graph below represents the distance a pilot is from the home airport during a period of time. which…
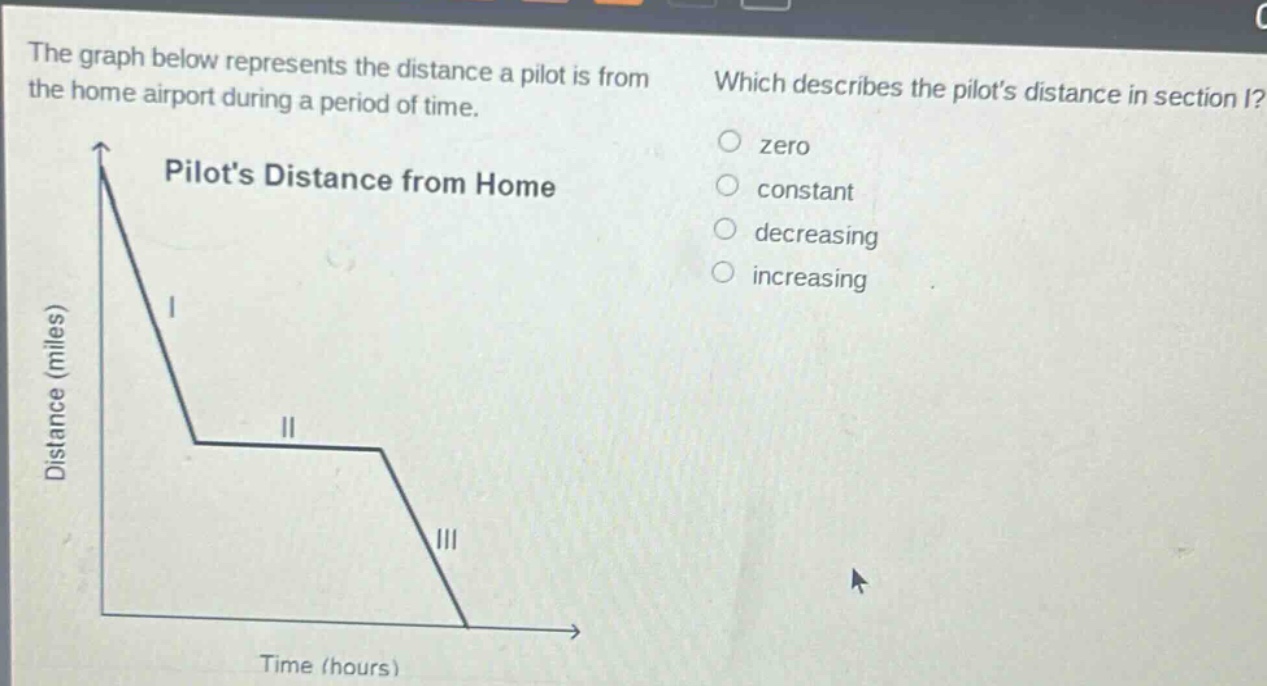
the graph below represents the distance a pilot is from the home airport during a period of time. which describes the pilots distance in section i? zero constant decreasing increasing pilots distance from home distance (miles) time (hours)
Answer
Brief Explanations:
In a distance - time graph, when the graph is sloping downwards, the distance is decreasing with respect to time. In section I of the given graph, the line representing the pilot's distance from home is sloping downwards as time progresses.
Answer:
decreasing