which graph represents an exponential function?
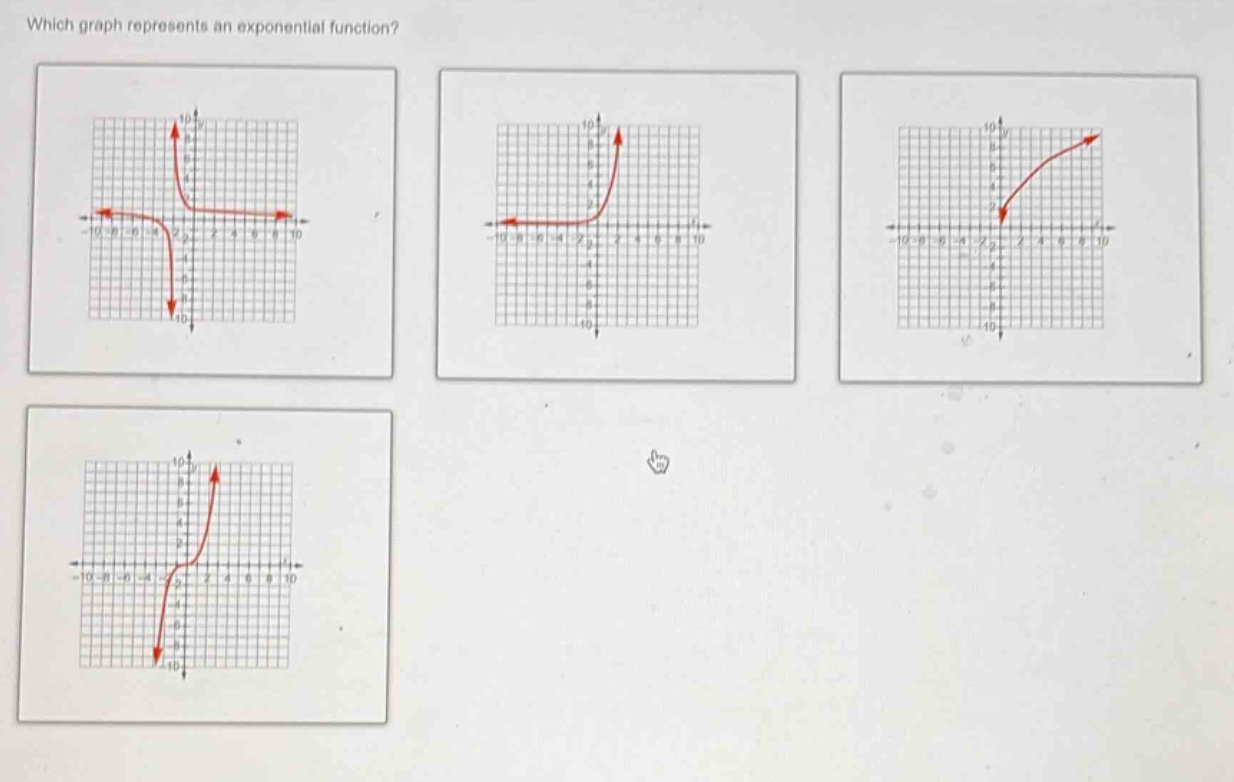
which graph represents an exponential function?
Answer
Explanation:
Step1: Recall exponential - function properties
An exponential function of the form $y = a\cdot b^{x}$ ($a\neq0$, $b>0,b\neq1$) has a horizontal asymptote. When $a>0$ and $b > 1$, the function is an increasing function with a horizontal asymptote at $y = 0$ (the $x$ - axis), and when $a>0$ and $0 < b<1$, the function is a decreasing function with a horizontal asymptote at $y = 0$.
Step2: Analyze the graphs
- The first graph has a horizontal asymptote and is a decreasing function for $x\in R$, which can be of the form $y=a\cdot b^{x}$ where $a>0$ and $0 < b<1$.
- The second graph has a horizontal asymptote and is an increasing function for $x\in R$, which can be of the form $y=a\cdot b^{x}$ where $a>0$ and $b > 1$.
- The third graph does not have a horizontal asymptote and is not an exponential - function graph.
- The fourth graph does not have a horizontal asymptote and is not an exponential - function graph.
Answer:
The first and the second graphs represent exponential functions.