which graph represents a function?
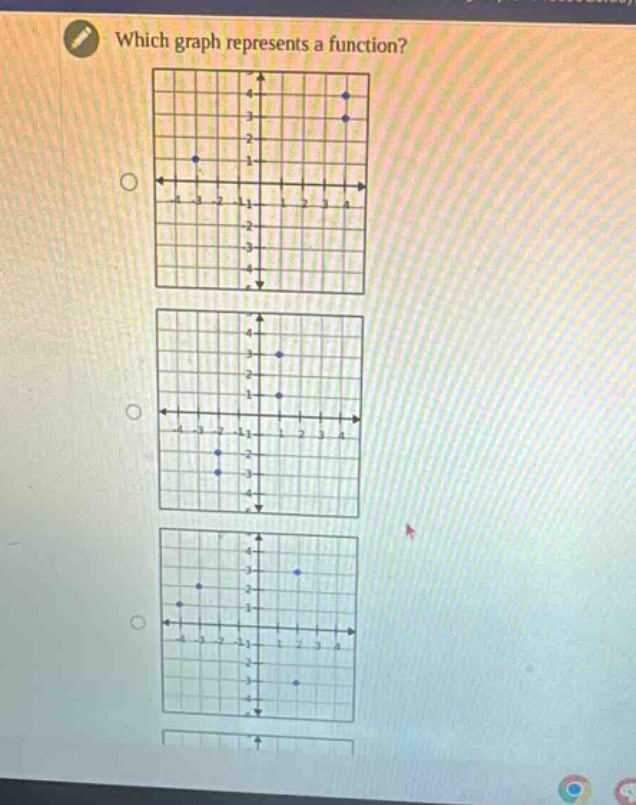
which graph represents a function?
Answer
Answer:
To determine which graph represents a function, we use the vertical - line test. A graph represents a function if any vertical line drawn on the graph intersects the graph at most once. Without seeing the actual content of the graphs clearly, we cannot give a specific graph as the answer. But the general method is to apply the vertical - line test to each of the given graphs. If for every x - value there is exactly one y - value, then the graph represents a function.
Explanation:
Step1: Recall function definition
A function is a relation where each input (x - value) has exactly one output (y - value).
Step2: Understand vertical - line test
A vertical line has the form x = a. If it intersects the graph more than once, there are multiple y - values for a single x - value.
Step3: Apply test to graphs
Check each graph. If any vertical line intersects graph at most once, it's a function.