which graph represents the function p(x) = |x - 1|?
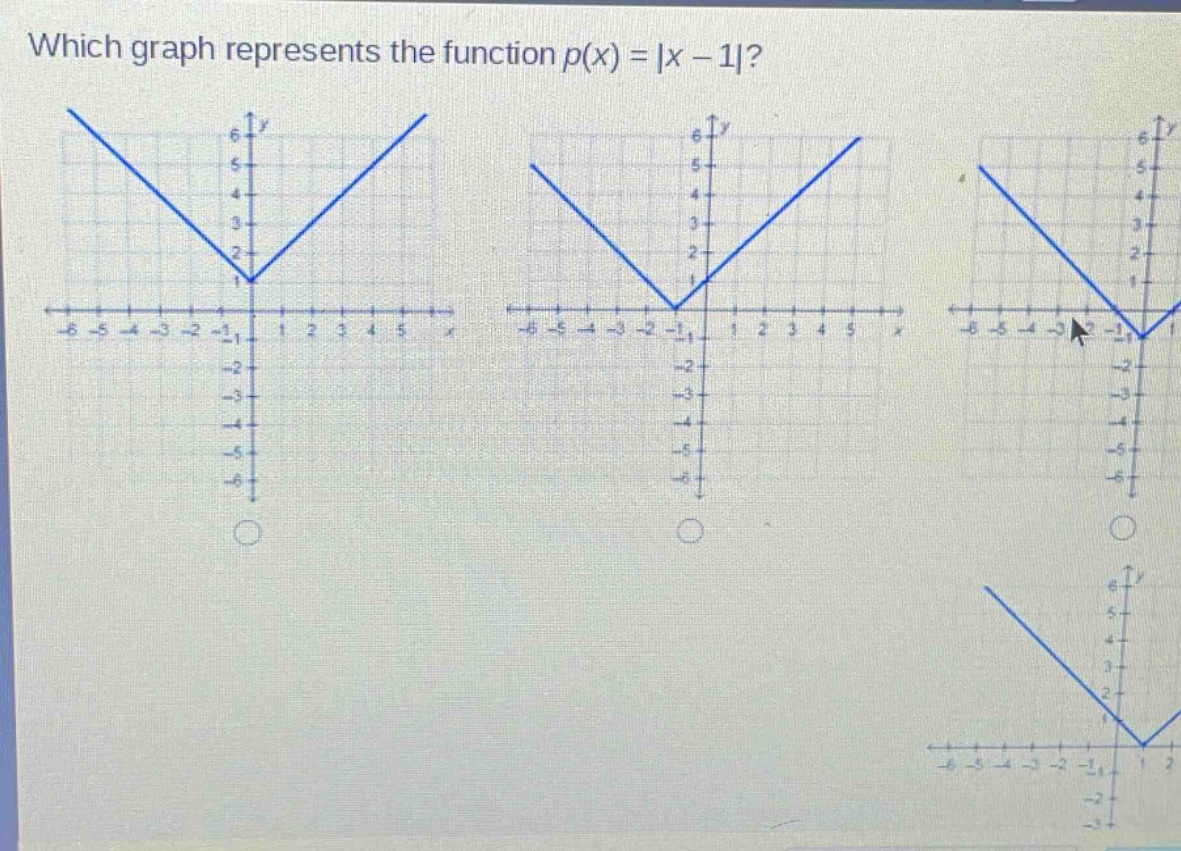
which graph represents the function p(x) = |x - 1|?
Answer
Explanation:
Step1: Recall absolute - value function properties
The general form of an absolute - value function is (y = |x - h|+k), and its vertex is at the point ((h,k)). For the function (p(x)=|x - 1|), (h = 1) and (k = 0), so the vertex of the function (y=|x - 1|) is at the point ((1,0)).
Step2: Analyze the behavior of the function for (x\gt1) and (x\lt1)
When (x\geq1), (p(x)=x - 1), which is a linear function with a slope of (1). When (x\lt1), (p(x)=-(x - 1)=-x + 1), which is a linear function with a slope of (- 1).
Answer:
The graph with the vertex at the point ((1,0)) (the second graph from the left among the visible ones if we assume a standard left - to - right order of the graphs)