which graph represents y as a function of x?
which graph represents y as a function of x?
Answer
Explanation:
Step1: Recall function - vertical line test
A relation is a function if for every x - value there is exactly one y - value. We use the vertical - line test. If a vertical line intersects the graph at more than one point, then y is not a function of x.
Step2: Analyze the first graph
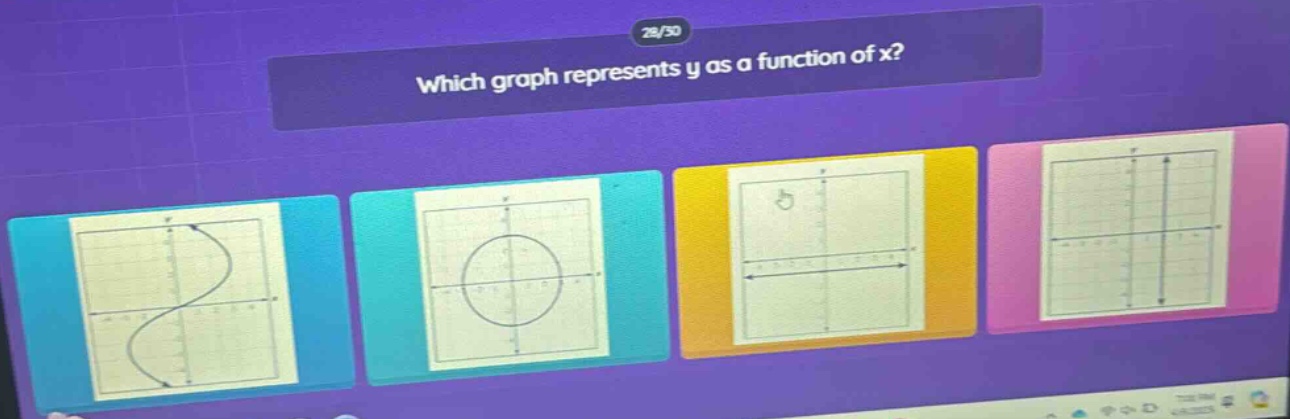
The first graph (the blue - colored one on the left) passes the vertical - line test. For any vertical line drawn on the graph, it will intersect the curve at most once.
Step3: Analyze the second graph
The second graph (the circle) fails the vertical - line test. A vertical line can intersect the circle at two points.
Step4: Analyze the third graph
The third graph (the horizontal line with two arrows) fails the vertical - line test. A vertical line can intersect the two horizontal segments at multiple points.
Step5: Analyze the fourth graph
The fourth graph (the vertical line) fails the vertical - line test. There are infinitely many y - values for a single x - value.
Answer:
The first graph (the blue - colored one on the left) represents y as a function of x.