which graph represents the function?\n$g(x) = \\begin{cases} -x - 2, & x \\le -2 \\\\ -x^2, & -2 < x < 0…
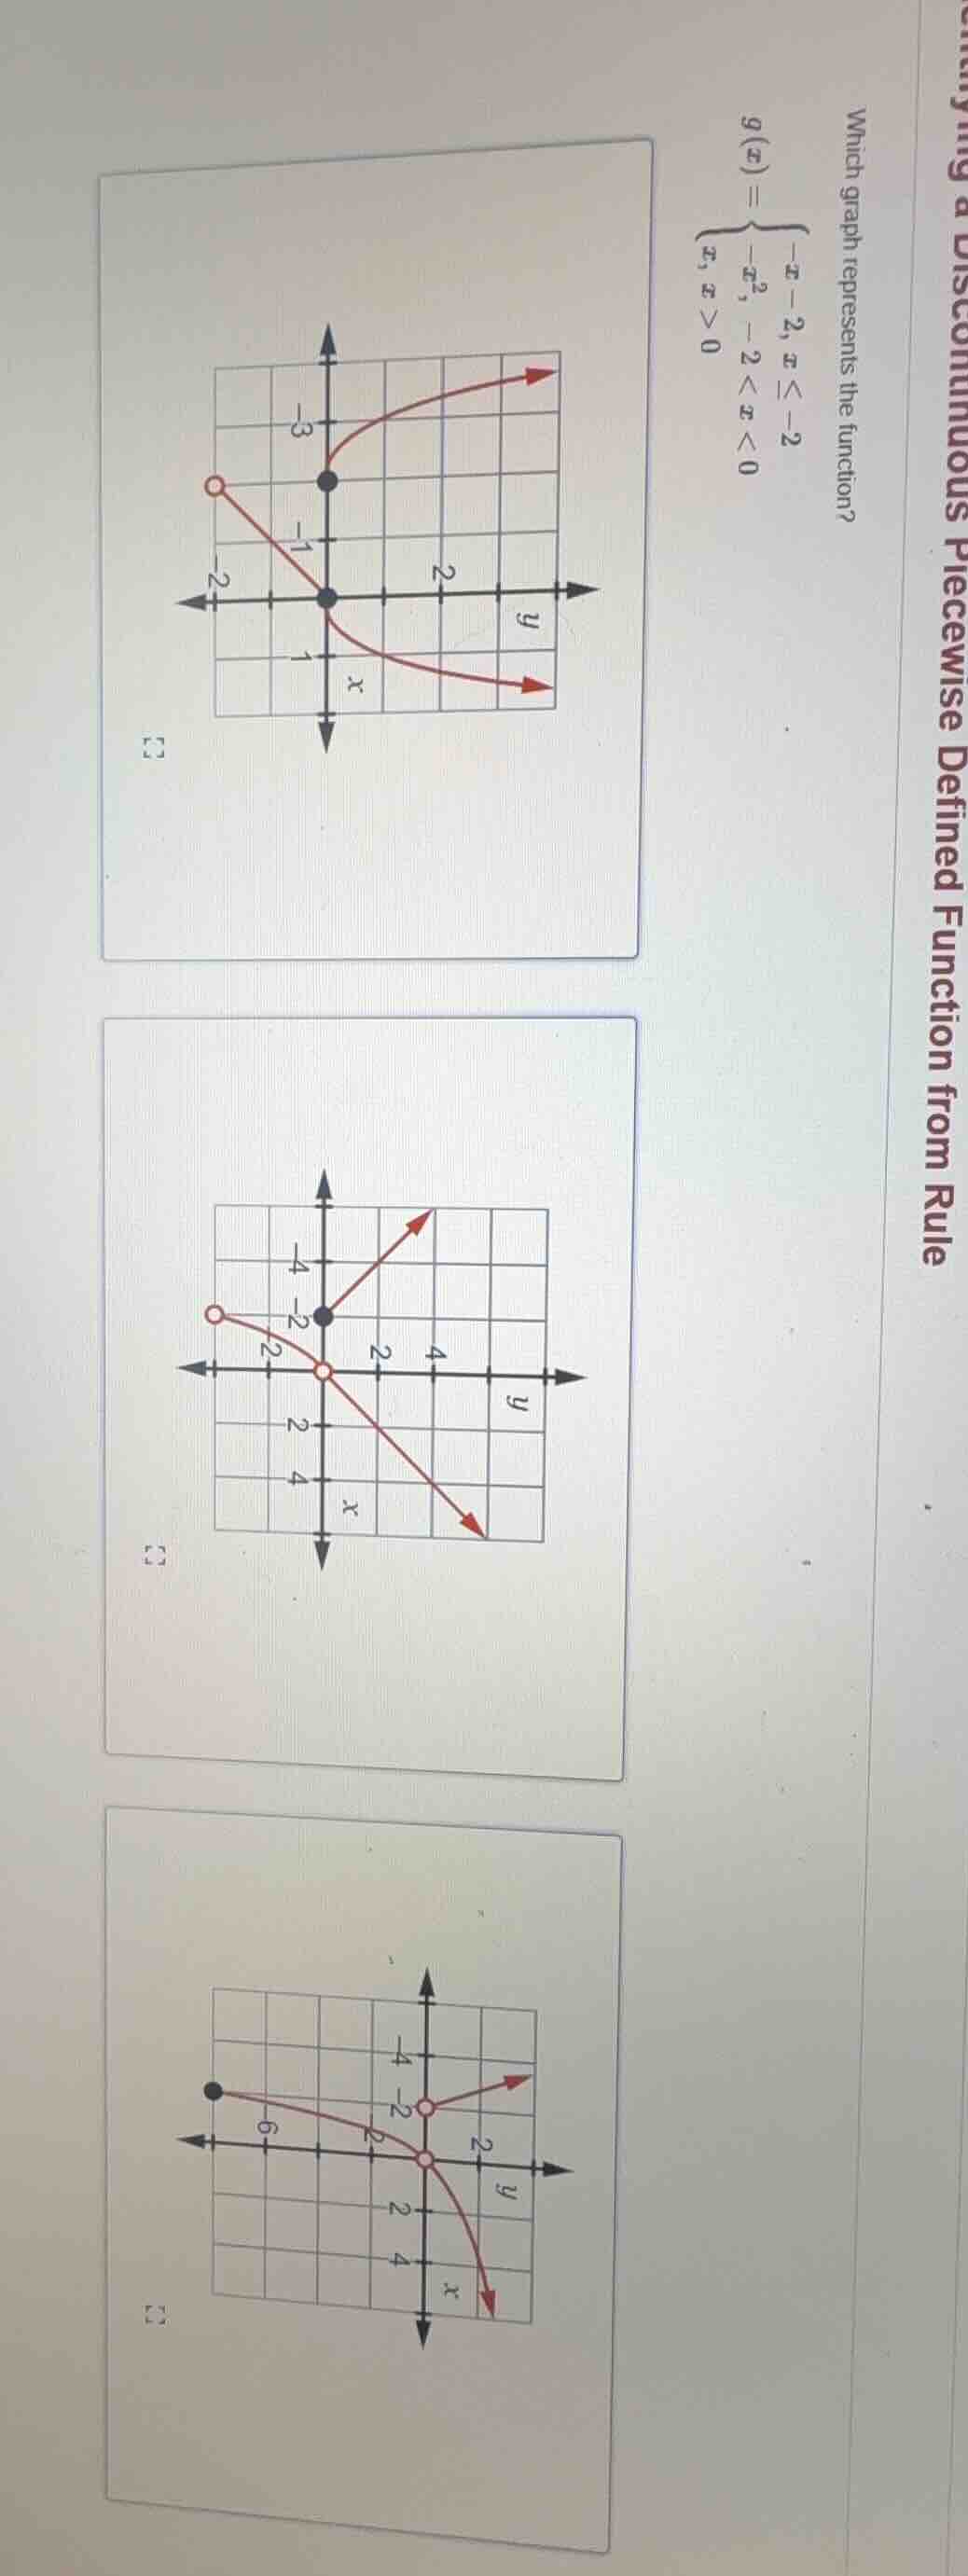
which graph represents the function?\n$g(x) = \\begin{cases} -x - 2, & x \\le -2 \\\\ -x^2, & -2 < x < 0 \\\\ x, & x > 0 \\end{cases}$
Answer
Explanation:
Step1: Analyze the first piece of the function
For $x \le -2$, the function is $g(x) = -x - 2$. This is a line with a negative slope and a solid point at $x = -2$. At $x = -2$, $g(-2) = -(-2) - 2 = 0$.
Step2: Analyze the second piece of the function
For $-2 < x < 0$, the function is $g(x) = -x^2$. This is a downward-opening parabola. It should have open circles at $x = -2$ and $x = 0$. At $x = -2$, $g(-2) = -(-2)^2 = -4$. At $x = 0$, $g(0) = -(0)^2 = 0$.
Step3: Analyze the third piece of the function
For $x > 0$, the function is $g(x) = x$. This is a line with a positive slope starting from an open circle at $(0, 0)$.
Step4: Match the pieces to the provided graphs
The first graph shows a line for $x \le -2$ ending at $(-2, 0)$, a downward parabola between $x = -2$ and $x = 0$ starting at $(-2, -4)$ and ending at $(0, 0)$, and a line $y = x$ for $x > 0$.
Answer:
The first graph (top-most image) represents the function $g(x)$.