which graph represents the function $f(x)=\frac{3}{2}(2)^x$?
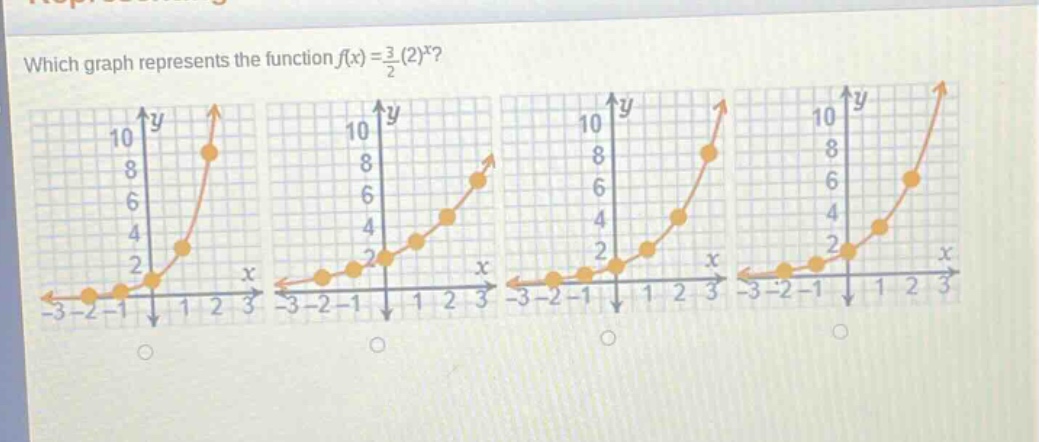
which graph represents the function $f(x)=\frac{3}{2}(2)^x$?
Answer
Explanation:
Step1: Find the y - intercept
When (x = 0), substitute into (y=\frac{3}{2}(2)^{x}). We get (y=\frac{3}{2}(2)^{0}=\frac{3}{2}\times1=\frac{3}{2}=1.5).
Step2: Analyze the growth behavior
The function (y = a\cdot b^{x}) with (a=\frac{3}{2}>0) and (b = 2>1) is an exponential - growth function. As (x) increases, (y) increases rapidly.
Step3: Check the graphs
We look for a graph that has a (y) - intercept at (y = 1.5) and shows exponential growth.
Answer:
The graph that has a (y) - intercept at (y = 1.5) (between (y = 1) and (y = 2)) and shows exponential growth is the correct one. Without specific labels for the graphs, we can't point out a particular graph by name, but it should have the described characteristics.