which graph represents the function $f(x)=\frac{1}{3}|x|$?
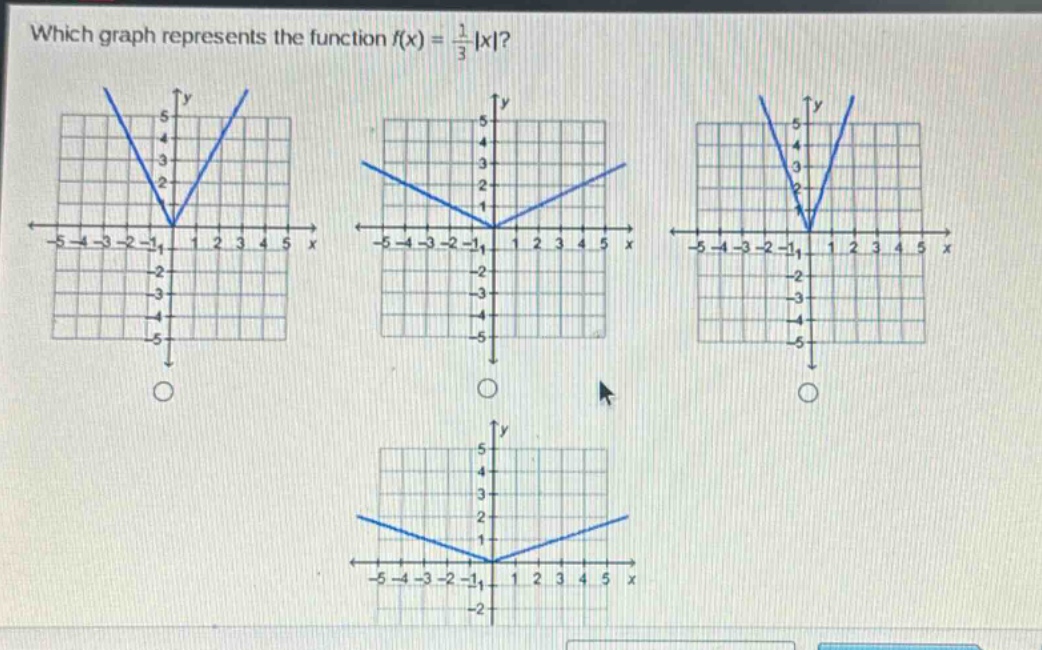
which graph represents the function $f(x)=\frac{1}{3}|x|$?
Answer
Explanation:
Step1: Analyze the function for (x\geq0)
When (x\geq0), (f(x)=\frac{1}{3}x). This is a linear - function with a slope of (\frac{1}{3}).
Step2: Analyze the function for (x < 0)
When (x<0), (f(x)=\frac{1}{3}(-x)=-\frac{1}{3}x). This is a linear - function with a slope of (-\frac{1}{3}).
Step3: Check key points
When (x = 3), (f(3)=\frac{1}{3}\times|3| = 1); when (x=-3), (f(-3)=\frac{1}{3}\times|-3| = 1).
The graph of (y = \frac{1}{3}|x|) is a V - shaped graph with the vertex at the origin ((0,0)) and is less steep than the graph of (y = |x|) because of the coefficient (\frac{1}{3}).
Answer:
The graph with a V - shape, vertex at ((0,0)), passing through the points ((3,1)) and ((-3,1)) (the second graph from the top - left in the order of the images shown, assuming a typical left - to - right, top - to - bottom order).