which graph represents the function $f(x)=\frac{1}{x}-1$?
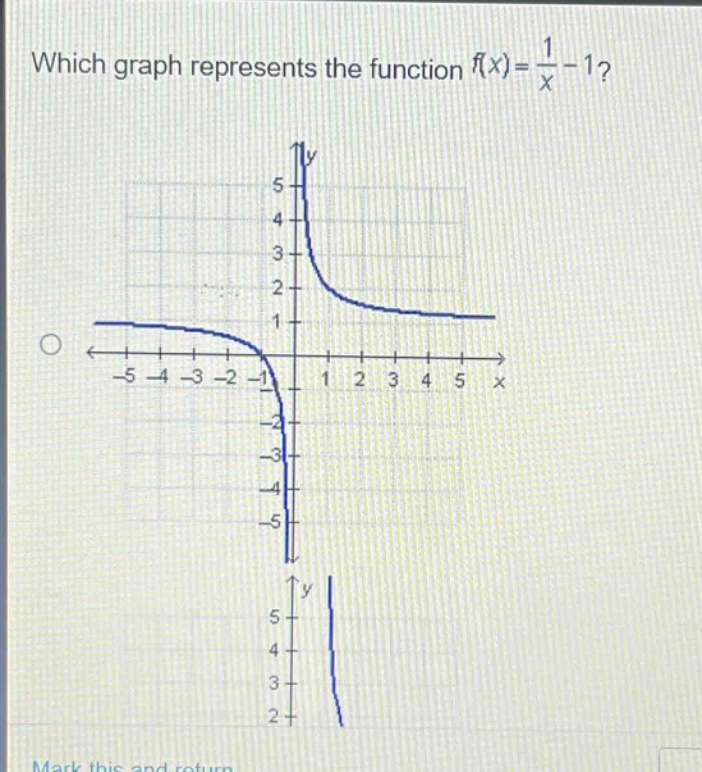
which graph represents the function $f(x)=\frac{1}{x}-1$?
Answer
Explanation:
Step1: Analyze the parent - function
The parent - function of $y = \frac{1}{x}-1$ is $y=\frac{1}{x}$, which has a vertical asymptote at $x = 0$ and a horizontal asymptote at $y = 0$.
Step2: Analyze the transformation
The function $y=\frac{1}{x}-1$ is a vertical shift of the function $y=\frac{1}{x}$ down by 1 unit. So, the vertical asymptote remains at $x = 0$, and the horizontal asymptote changes to $y=-1$. When $x = 1$, $y=\frac{1}{1}-1=0$. When $x=-1$, $y=\frac{1}{-1}-1=-2$.
The graph that has a vertical asymptote at $x = 0$, a horizontal asymptote at $y=-1$, passes through the points $(1,0)$ and $(-1, - 2)$ is the correct one.
Answer:
The first graph shown (assuming the first graph has the correct asymptotes and passes through the appropriate points as described above)