which graph represents a function with a growth factor of 5?
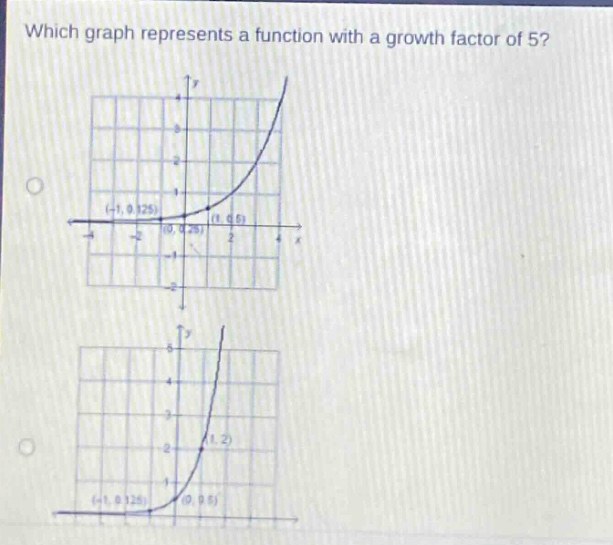
which graph represents a function with a growth factor of 5?
Answer
Explanation:
Step1: Recall exponential - function form
The general form of an exponential function is $y = ab^{x}$, where $b$ is the growth factor.
Step2: Check points on the graph
For an exponential function $y = ab^{x}$, when $x = 0$, $y=a$. When $x = 1$, $y=ab$. If the growth factor $b = 5$, then when $x$ increases by 1, the $y$ - value should be 5 times the previous $y$ - value. Let's assume the function is of the form $y = ab^{x}$. When $x = 0$, $y=a$. When $x = 1$, $y = ab$. If $b = 5$, then $\frac{y(x = 1)}{y(x = 0)}=5$. For the first graph: If we assume the function is $y = ab^{x}$, when $x = 0$, $y = 0.2$ (from the point $(0,0.2)$), when $x = 1$, $y = 1$ (from the point $(1,1)$). And $\frac{y(1)}{y(0)}=\frac{1}{0.2}=5$. For the second graph: When $x = 0$, $y = 0.5$ (from the point $(0,0.5)$), when $x = 1$, $y = 2$ (from the point $(1,2)$). And $\frac{y(1)}{y(0)}=\frac{2}{0.5}=4\neq5$.
Answer:
The first graph.