which graph represents the function $f(x)=sqrt3{x - 2}$?
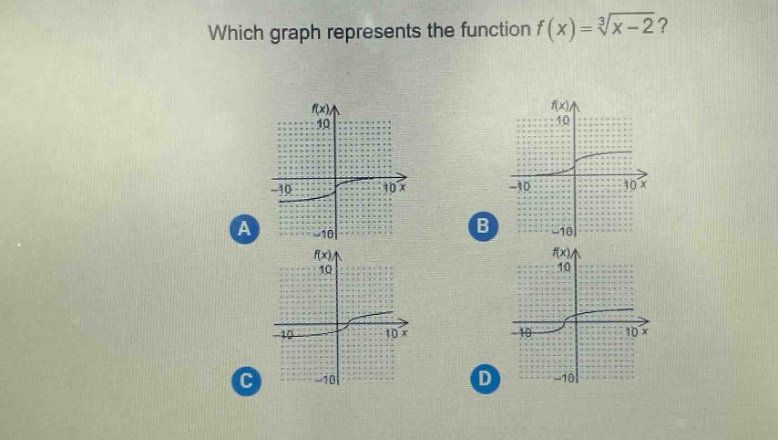
which graph represents the function $f(x)=sqrt3{x - 2}$?
Answer
Explanation:
Step1: Analyze the parent - function
The parent - function of $y = \sqrt[3]{x}$ has a domain of all real numbers ($x\in(-\infty,\infty)$) and a range of all real numbers ($y\in(-\infty,\infty)$), and it passes through the origin $(0,0)$.
Step2: Analyze the transformation
The function $f(x)=\sqrt[3]{x - 2}$ is a horizontal shift of the parent - function $y=\sqrt[3]{x}$ to the right by 2 units. When $x = 2$, $f(2)=\sqrt[3]{2 - 2}=0$. So the graph of $y = \sqrt[3]{x-2}$ passes through the point $(2,0)$.
Answer:
The graph that passes through the point $(2,0)$ represents the function $f(x)=\sqrt[3]{x - 2}$. Without seeing the specific details of each graph in your options, if you check which graph has the $x$ - intercept at $x = 2$, that is the correct one.