which graph represents a geometric sequence?
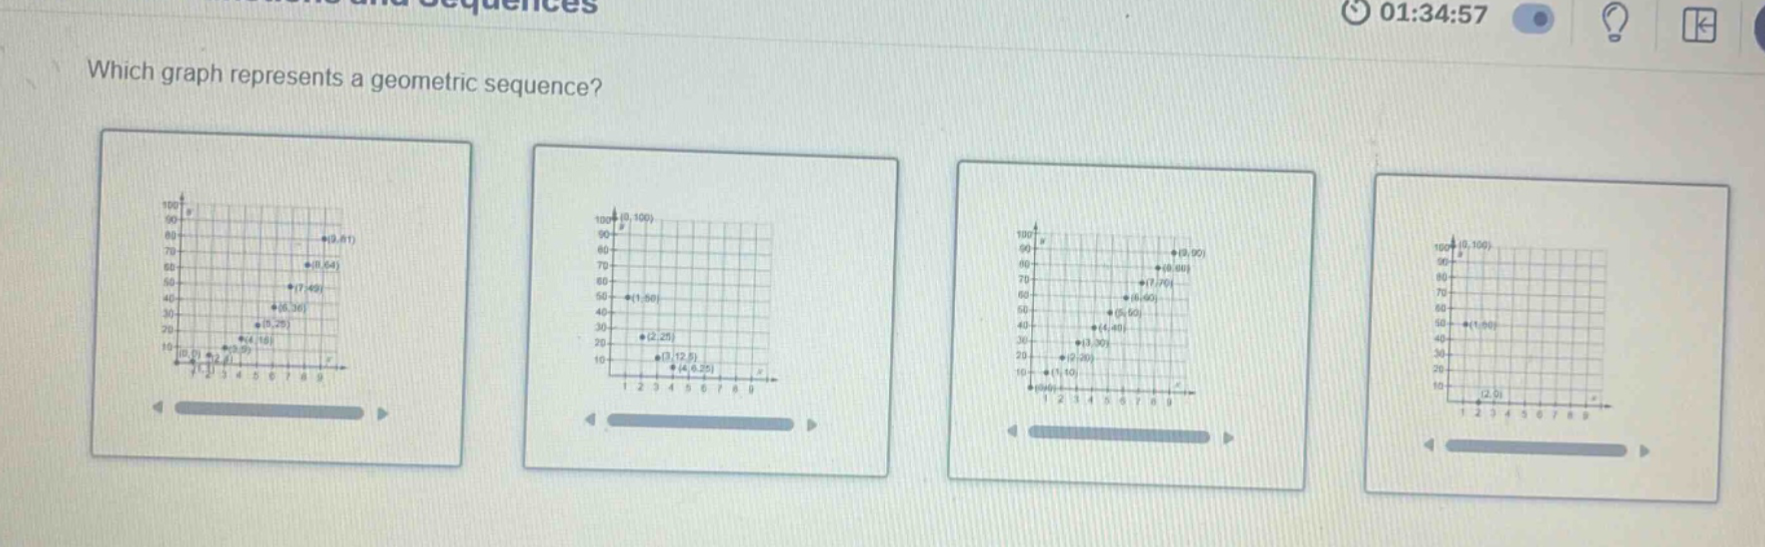
which graph represents a geometric sequence?
Answer
Explanation:
Step1: Recall geometric - sequence property
A geometric sequence has a common ratio between consecutive terms. On a graph of a geometric sequence (y = a\cdot r^{x}) (where (a) is the first - term and (r) is the common ratio), the points ((x,y)) follow an exponential - like pattern.
Step2: Analyze the graphs
For a geometric sequence (y_n=a\cdot r^{n - 1}), when (n = 1,2,3,\cdots), the ratio (\frac{y_{n+1}}{y_n}=r). The graph of a geometric sequence will have points that follow an exponential curve. Points on the graph of a geometric sequence ((n,a\cdot r^{n - 1})) will show exponential growth ((r>1)) or decay ((0 < r<1)).
Answer:
The graph with points that follow an exponential - like pattern (usually a curve that gets steeper or less steep depending on the value of the common ratio (r)) represents a geometric sequence. Without specific labels and values on the given graphs, we can't identify the exact one, but look for a graph where the (y) - values change by a common ratio as the (x) - values increase by 1.