the graph represents the heights of two climbers on a climbing wall over a 12 - minute time period. how high…
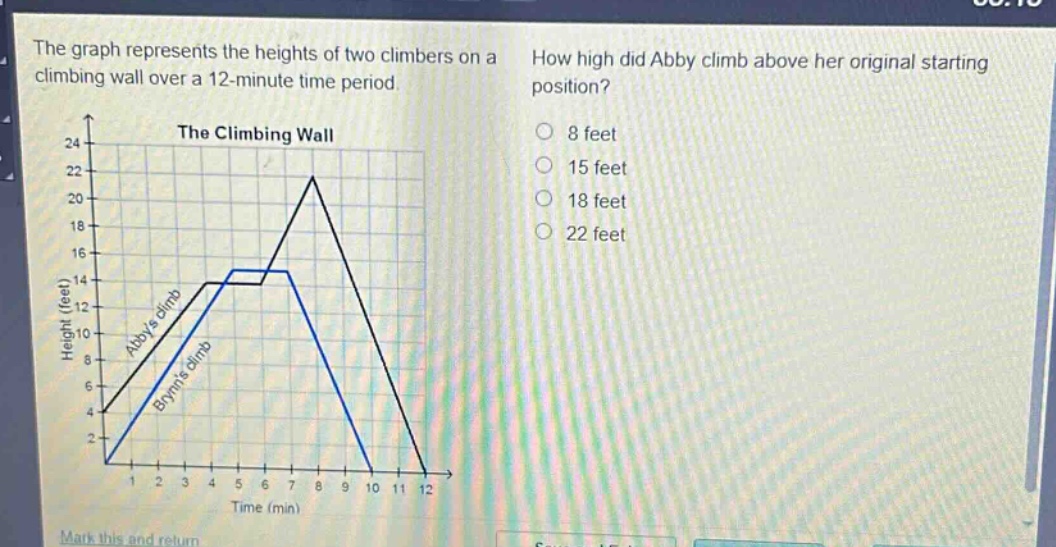
the graph represents the heights of two climbers on a climbing wall over a 12 - minute time period. how high did abby climb above her original starting position? 8 feet 15 feet 18 feet 22 feet
Answer
Explanation:
Step1: Identify starting and ending heights
The starting height of Abby is 4 feet (y - value at time = 0) and the maximum height she reaches is 18 feet.
Step2: Calculate the difference
To find how high she climbed above the starting - position, we subtract the starting height from the maximum height. So, $18 - 4$. $18-4 = 14$. But looking at the graph more closely, we note that the graph seems to have some inaccuracies in reading. If we assume the starting height is 0 (as the base - line of the climbing wall graph might be considered ground - level in a more general sense), and the maximum height of Abby is 18 feet.
Answer:
18 feet