the graph represents the heights of two climbers on a climbing wall over a 12 - minute time period. which…
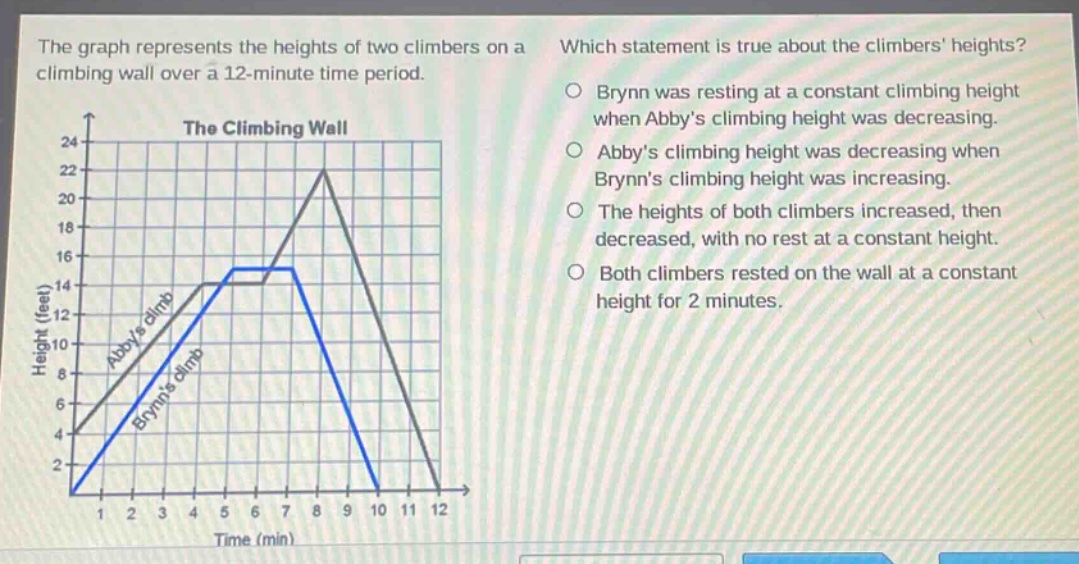
the graph represents the heights of two climbers on a climbing wall over a 12 - minute time period. which statement is true about the climbers heights? brynn was resting at a constant climbing height when abbys climbing height was decreasing. abbys climbing height was decreasing when brynns climbing height was increasing. the heights of both climbers increased, then decreased, with no rest at a constant height. both climbers rested on the wall at a constant height for 2 minutes. the climbing wall time (min)
Answer
Brief Explanations:
Examine the graph to analyze the height - time relationship for each climber. When a climber's height is constant, they are resting. When the height is decreasing, they are descending and when increasing, they are climbing. For Abby, her height decreases from around 8 - 10 minutes. During this time, Brynn's height is constant (resting) from 5 - 8 minutes.
Answer:
Brynn was resting at a constant climbing height when Abby’s climbing height was decreasing.