which graph represents a linear function?
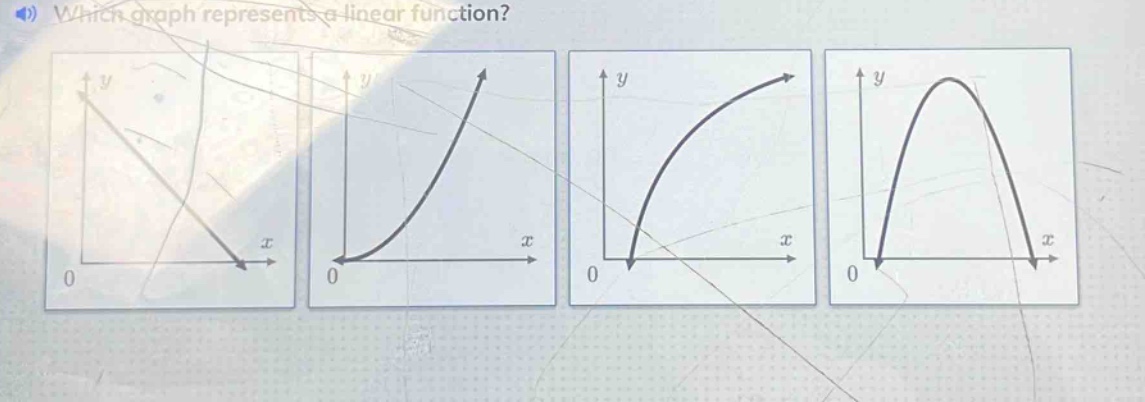
which graph represents a linear function?
Answer
Brief Explanations:
A linear function has a graph that is a straight - line. Among the given graphs, only the first graph (the one with a straight - line sloping downwards from left to right) represents a linear function. The other graphs are curved, which represent non - linear functions.
Answer:
The first graph (the one with a straight - line sloping downwards from left to right)