9. the graph below represents randys drive to school. which of the following is a correct conclusion based…
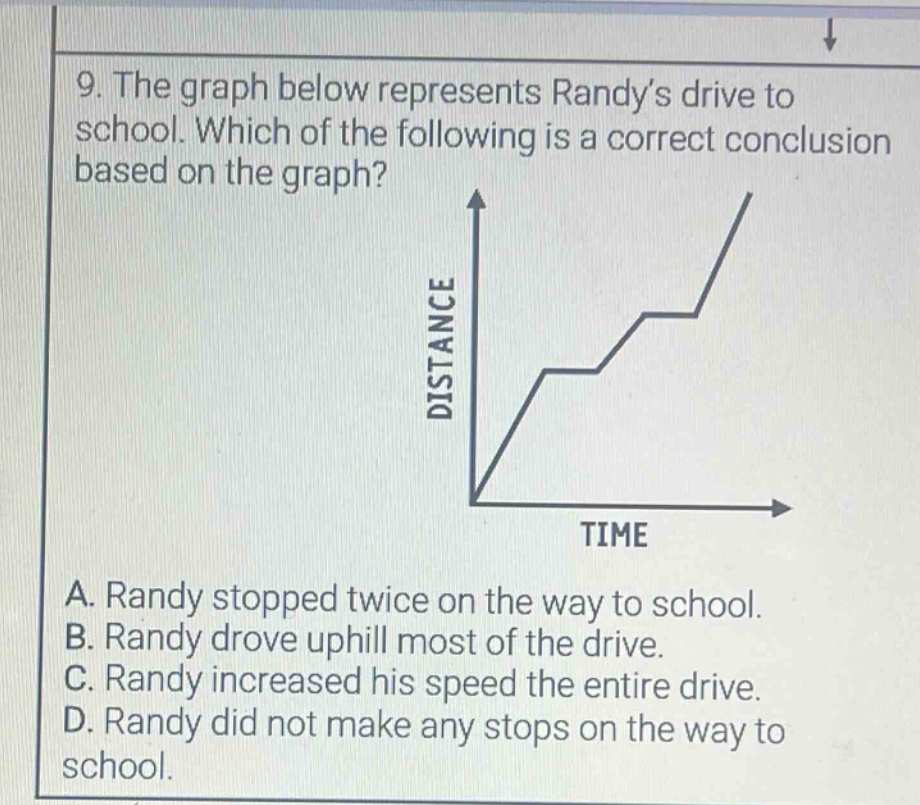
9. the graph below represents randys drive to school. which of the following is a correct conclusion based on the graph? a. randy stopped twice on the way to school. b. randy drove uphill most of the drive. c. randy increased his speed the entire drive. d. randy did not make any stops on the way to school.
Answer
Explanation:
Step1: Analyze the graph
In a distance - time graph, horizontal segments indicate that the distance is not changing with time. This means the object (in this case Randy's car) is at rest.
Step2: Count horizontal segments
The graph has two horizontal segments. Each horizontal segment represents a stop.
Answer:
A. Randy stopped twice on the way to school.