the graph below represents the relationship between the number of days a book is overdue and the library…
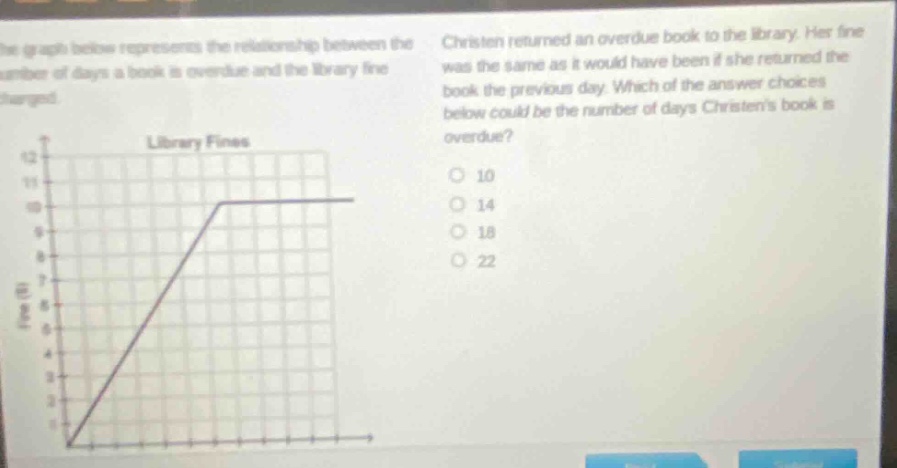
the graph below represents the relationship between the number of days a book is overdue and the library fine charged. christen returned an overdue book to the library. her fine was the same as it would have been if she returned the book the previous day. which of the answer choices below could be the number of days christens book is overdue? 10 14 18 22
Answer
Explanation:
Step1: Analyze the graph
The graph shows a linear - like increase in fines up to a certain point, after which the fine remains constant. We need to find the number of days for which the fine doesn't change from the previous day.
Step2: Observe the flat - part of the graph
The flat - part of the graph starts at the 14th day. This means that for days 14 and beyond, the fine remains the same. If the fine is the same as it would have been if the book was returned the previous day, the book must be in the flat - fine region of the graph.
Answer:
14