the graph represents revenue in dollars as a function of greeting cards sold. which equation represents the…
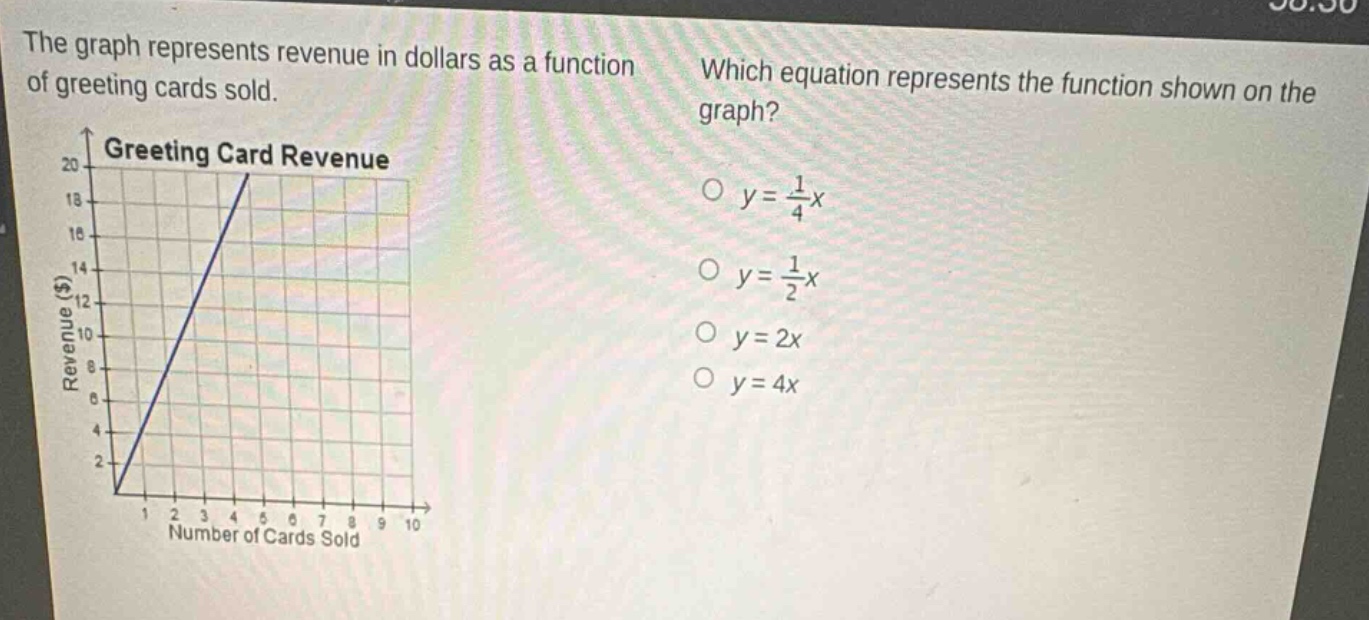
the graph represents revenue in dollars as a function of greeting cards sold. which equation represents the function shown on the graph? greeting card revenue revenue ($) 20 18 16 14 12 10 8 6 4 2 0 1 2 3 4 5 6 7 8 9 10 number of cards sold o y = 1/4x o y = 1/2x o y = 2x o y = 4x
Answer
Explanation:
Step1: Identify two points on the line
Let's take the points (0, 0) and (5, 20) from the graph.
Step2: Use the slope - formula
The slope formula is $m=\frac{y_2 - y_1}{x_2 - x_1}$. Substituting $x_1 = 0,y_1 = 0,x_2=5,y_2 = 20$ into the formula, we get $m=\frac{20 - 0}{5 - 0}=\frac{20}{5}=4$.
Step3: Determine the equation of the line
The equation of a line in slope - intercept form is $y=mx + b$. Since the line passes through the origin $(0,0)$, the y - intercept $b = 0$. With $m = 4$, the equation is $y=4x$.
Answer:
$y = 4x$