which graph represents the solution for $x^{2}+x - 12>0$?
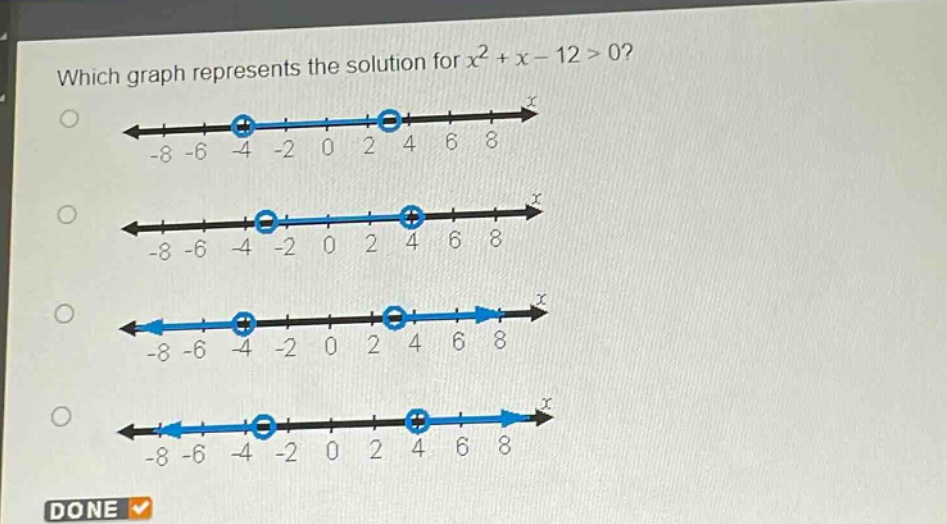
which graph represents the solution for $x^{2}+x - 12>0$?
Answer
Answer:
The third graph (the one with arrows pointing outwards from - 4 and 3 on the number - line).
Explanation:
Step1: Factor the quadratic inequality
$x^{2}+x - 12=(x + 4)(x - 3)>0$
Step2: Find the roots
Set $(x + 4)(x - 3)=0$. The roots are $x=-4$ and $x = 3$.
Step3: Determine the solution intervals
We consider the intervals $(-\infty,-4)$, $(-4,3)$ and $(3,\infty)$. Test a value from each interval:
- For $x=-5$ in $(-\infty,-4)$: $(-5 + 4)(-5 - 3)=(-1)\times(-8)=8>0$.
- For $x = 0$ in $(-4,3)$: $(0 + 4)(0 - 3)=(4)\times(-3)=-12<0$.
- For $x = 4$ in $(3,\infty)$: $(4 + 4)(4 - 3)=(8)\times(1)=8>0$. The solution of the inequality $x^{2}+x - 12>0$ is $x<-4$ or $x>3$, which is represented by the number - line with open - circles at $x=-4$ and $x = 3$ and arrows pointing outwards from these points.