which graph represents the solution set of the inequality -9 > x?
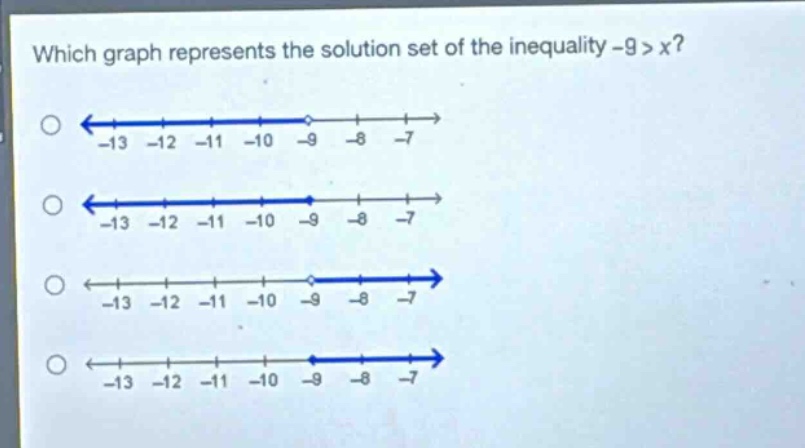
which graph represents the solution set of the inequality -9 > x?
Answer
Explanation:
Step1: Interpret the inequality
The inequality $- 9>x$ means $x < - 9$.
Step2: Analyze graph features
For $x < - 9$, on a number - line graph, there should be an open circle at $-9$ (since $x$ cannot equal $-9$) and the line should extend to the left (towards smaller numbers).
Answer:
The first graph (the one with an open circle at -9 and the line extending to the left)