which graph represents the solution set of the inequality -14.5 < x?
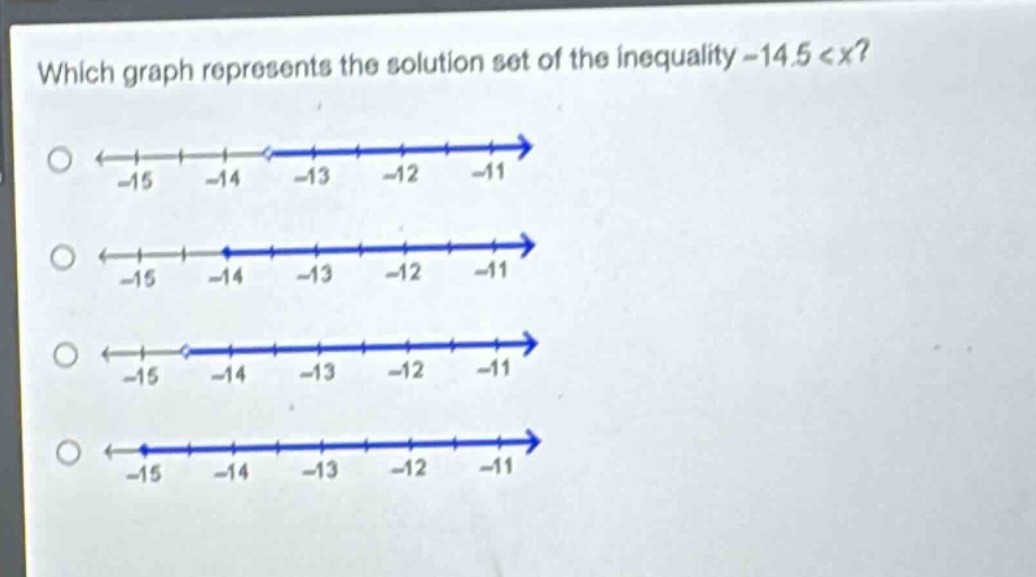
which graph represents the solution set of the inequality -14.5 < x?
Answer
Answer:
The third graph (the one with an open - circle at - 14 and an arrow pointing to the right).
Explanation:
Step1: Understand the inequality
The inequality is $- 14.5<x$, which means $x$ is greater than - 14.5.
Step2: Analyze graph features
On a number - line graph, for $x > a$, we use an open - circle at $a$ (since $x$ is not equal to $a$) and an arrow pointing to the right (towards larger values). Here $a=-14.5$. Among the given graphs, the graph with an open - circle at approximately - 14 (closest to - 14.5 among the marked integers) and an arrow pointing to the right represents the solution set.