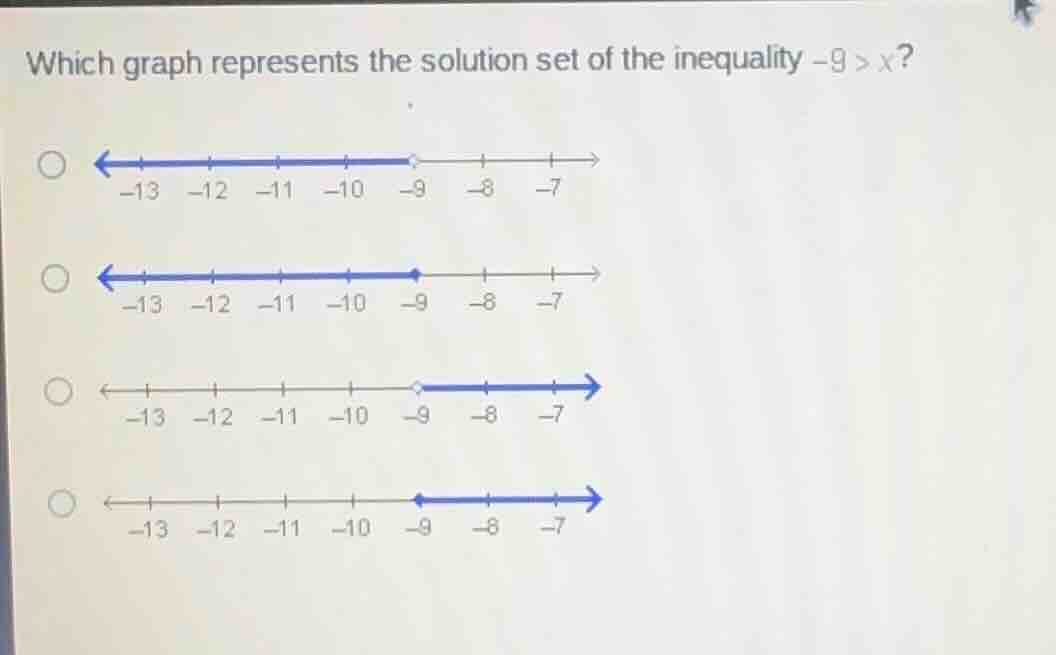
which graph represents the solution set of the inequality $-9 > x$?
which graph represents the solution set of the inequality $-9 > x$?
Answer
Explanation:
Step1: Rewrite the inequality
Rewrite $-9 > x$ with the variable on the left side. $$x < -9$$
Step2: Determine the circle type
Since the inequality is strictly "less than" ($<$), use an open circle. $$\text{Open circle at } -9$$
Step3: Determine the shading direction
Values less than $-9$ are located to the left on the number line. $$\text{Shade to the left of } -9$$
Answer:
The first graph (an open circle at -9 with shading to the left).