which graph represents the solution set for the inequality $\frac{1}{2}xleq18$?
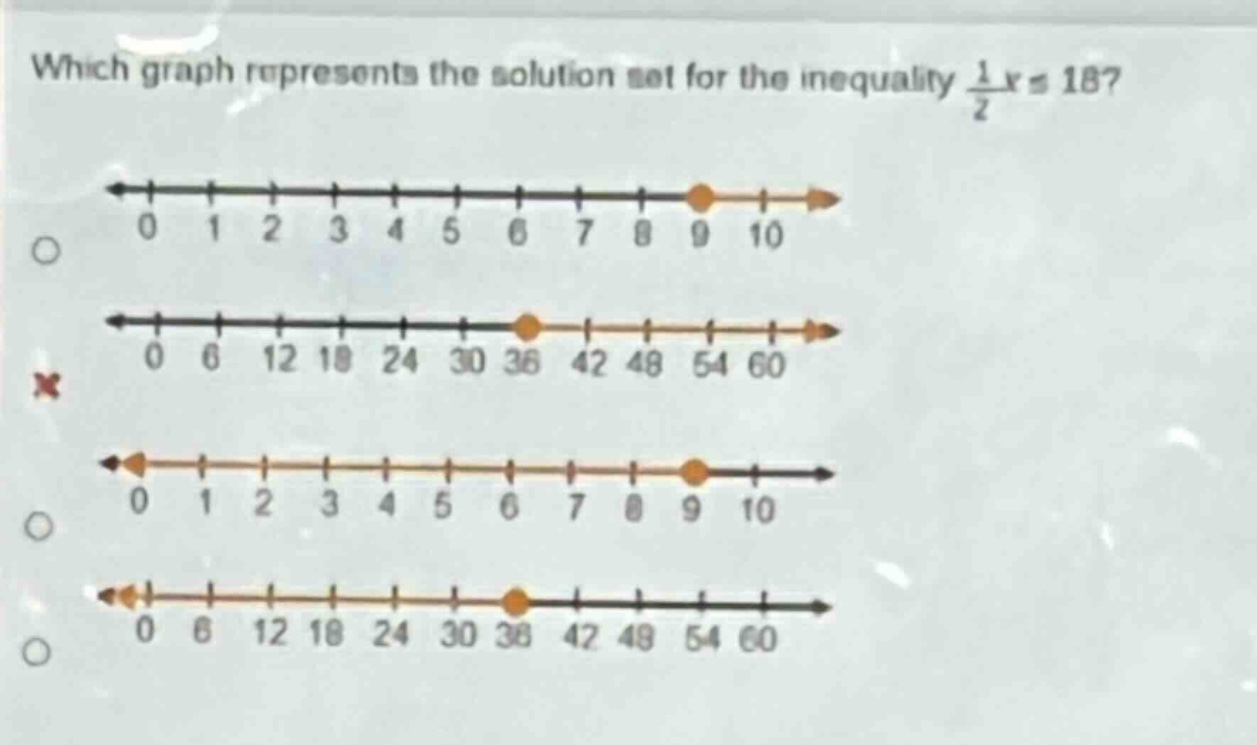
which graph represents the solution set for the inequality $\frac{1}{2}xleq18$?
Answer
Explanation:
Step1: Solve the inequality
Multiply both sides by 2: $\frac{1}{2}x\times2\leq18\times2$, so $x\leq36$.
Step2: Analyze the graph
The solution set $x\leq36$ is represented by a number - line with a closed - circle at 36 (because the inequality includes equality) and the line extending to the left.
Answer:
The second graph (with a closed - circle at 36 and the line extending to the left)