which graph represents the solution set for the system s + l < 30 and 8s + 12l ≤ 160?
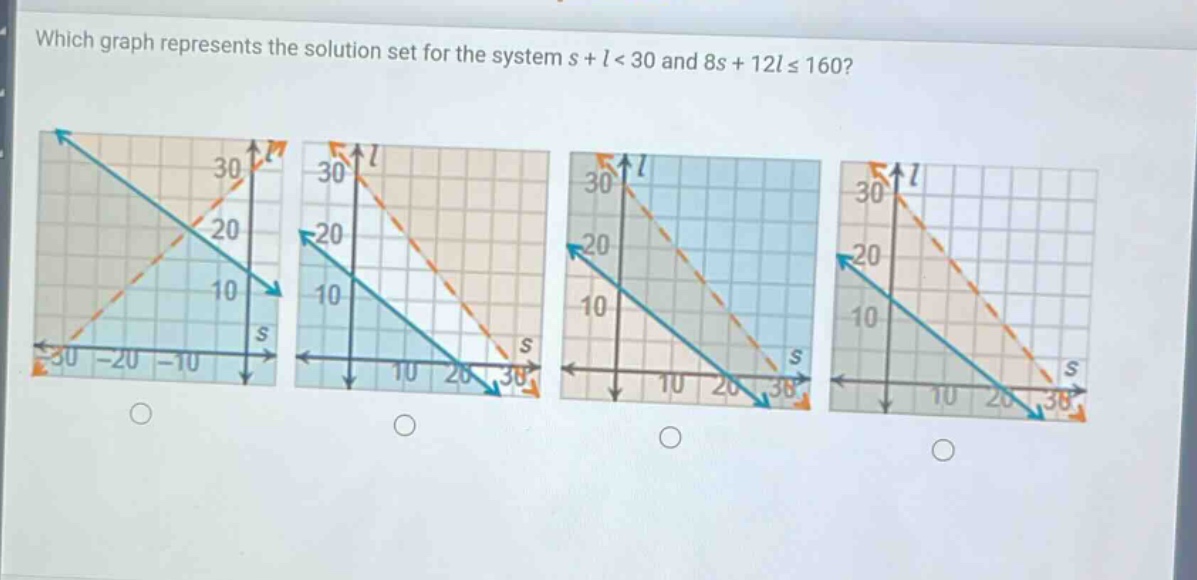
which graph represents the solution set for the system s + l < 30 and 8s + 12l ≤ 160?
Answer
Explanation:
Step1: Rewrite the first - inequality
Rewrite $s + l<30$ as $l < - s+30$. The boundary line is $l=-s + 30$ and it is a dashed line (since the inequality is $<$) with a $y$ - intercept of 30 and a slope of - 1.
Step2: Rewrite the second - inequality
Rewrite $8s + 12l\leq160$ as $12l\leq - 8s + 160$, then $l\leq-\frac{2}{3}s+\frac{40}{3}$. The boundary line is $l =-\frac{2}{3}s+\frac{40}{3}$ and it is a solid line (since the inequality is $\leq$). When $s = 0$, $l=\frac{40}{3}\approx13.33$, and when $l = 0$, $s = 20$.
Step3: Test a point
Test the point $(0,0)$ in both inequalities. For $s + l<30$, when $s = 0$ and $l = 0$, $0+0=0<30$ (true). For $8s + 12l\leq160$, when $s = 0$ and $l = 0$, $8\times0+12\times0=0\leq160$ (true). So the solution set contains the origin.
The solution set of the system of inequalities is the region that satisfies both inequalities simultaneously. The region below the dashed line $l=-s + 30$ and below (or on) the solid line $l=-\frac{2}{3}s+\frac{40}{3}$ and containing the origin is the correct solution - set region.
Answer:
The graph where the region below the dashed line $l=-s + 30$ and below (or on) the solid line $l =-\frac{2}{3}s+\frac{40}{3}$ and contains the origin. (Without seeing the specific labels of the graphs, this is a description - based answer. If the graphs are numbered or have other identifiers, the correct one can be pointed out more precisely with more information about the graphs.)