how does the graph of y = sec(x + 3) - 7 compare with the graph of y = sec(x)?\nit is the graph of y =…
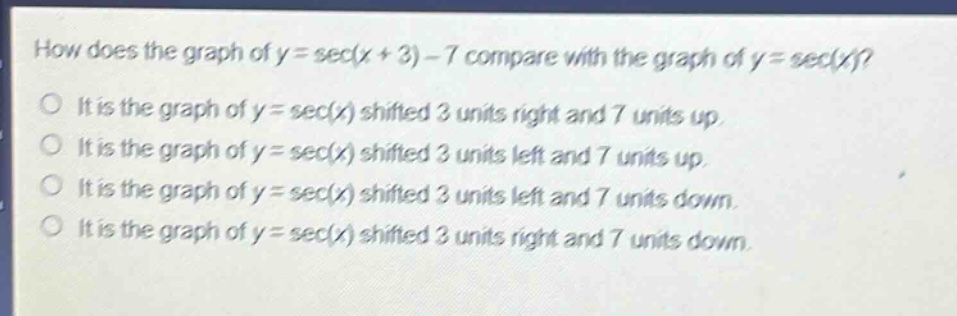
how does the graph of y = sec(x + 3) - 7 compare with the graph of y = sec(x)?\nit is the graph of y = sec(x) shifted 3 units right and 7 units up.\nit is the graph of y = sec(x) shifted 3 units left and 7 units up.\nit is the graph of y = sec(x) shifted 3 units left and 7 units down.\nit is the graph of y = sec(x) shifted 3 units right and 7 units down.
Answer
Brief Explanations:
For a function $y = f(x + a)+b$, if $a>0$, the graph of $y = f(x)$ shifts $a$ units to the left, and if $b < 0$, the graph shifts $|b|$ units down. In $y=\sec(x + 3)-7$, $a = 3$ and $b=-7$. So the graph of $y=\sec(x)$ shifts 3 units left and 7 units down.
Answer:
It is the graph of $y = \sec(x)$ shifted 3 units left and 7 units down.