the graph of y = f(x) is shown below. draw the graph of y = -f(x).
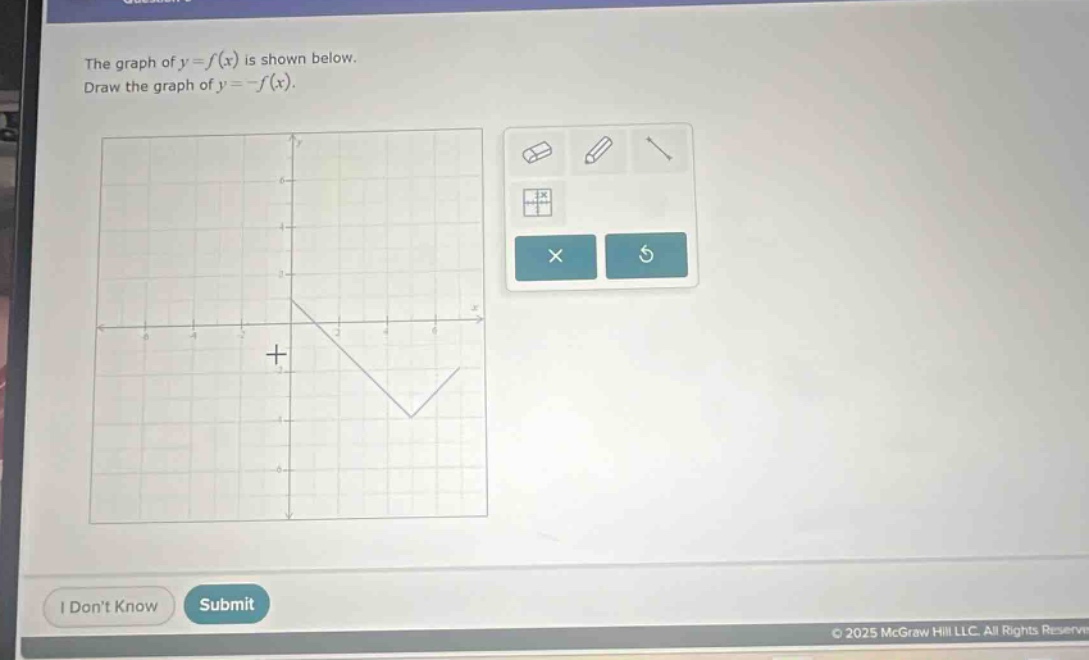
the graph of y = f(x) is shown below. draw the graph of y = -f(x).
Answer
Explanation:
Step1: Recall transformation rule
The transformation $y = - f(x)$ reflects the graph of $y=f(x)$ over the $x -$axis. For every point $(x,y)$ on the graph of $y = f(x)$, the corresponding point on the graph of $y=-f(x)$ is $(x, - y)$.
Step2: Identify key points
Identify key points on the graph of $y = f(x)$ such as endpoints, turning - points. Let's say a point on $y = f(x)$ is $(x_0,y_0)$.
Step3: Find new points
The corresponding point on $y=-f(x)$ will be $(x_0,-y_0)$. Plot these new points.
Step4: Draw the new graph
Connect the new points with a smooth curve (or line - segments depending on the nature of $y = f(x)$) to get the graph of $y=-f(x)$.
Answer:
The graph of $y = - f(x)$ is the reflection of the given graph of $y = f(x)$ over the $x -$axis. To draw it, take each point $(x,y)$ on the graph of $y = f(x)$ and plot the point $(x, - y)$ and then connect these new points.