the graph of y = f(x) is shown below. draw the graph of y = \\frac{1}{2}f(x).
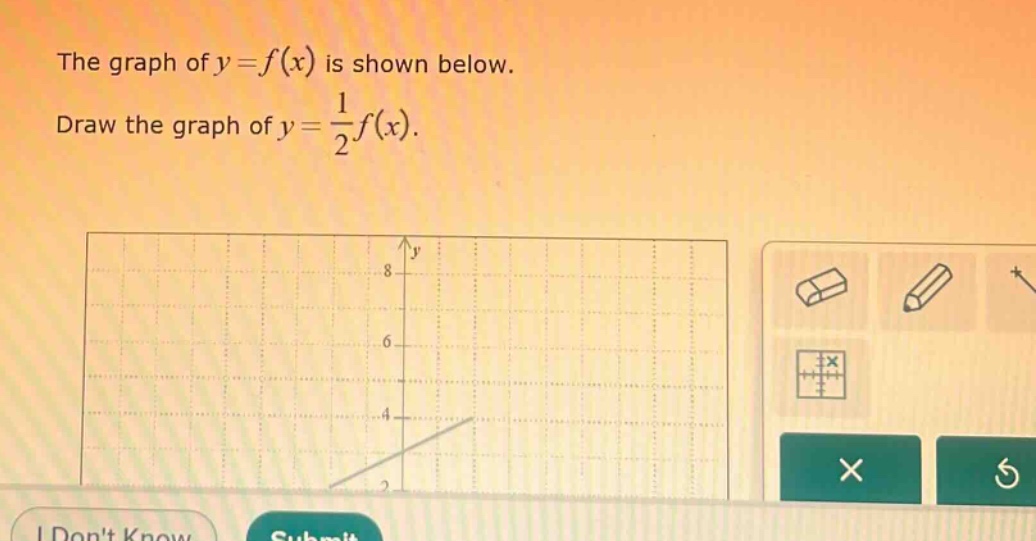
the graph of y = f(x) is shown below. draw the graph of y = \\frac{1}{2}f(x).
Answer
Explanation:
Step1: Understand vertical - scaling
When we have a transformation of the form $y = af(x)$ where $0 < a<1$, it is a vertical compression. Here $a=\frac{1}{2}$.
Step2: Take points on $y = f(x)$
Let's assume we have a point $(x_0,y_0)$ on the graph of $y = f(x)$. For the graph of $y=\frac{1}{2}f(x)$, the corresponding point will be $(x_0,\frac{1}{2}y_0)$.
Step3: Plot new points
For each point on the original graph of $y = f(x)$, find the new $y$ - coordinate by multiplying the original $y$ - coordinate by $\frac{1}{2}$ and plot these new points. Then connect the new points to form the graph of $y=\frac{1}{2}f(x)$.
Answer:
To draw the graph of $y = \frac{1}{2}f(x)$, take each point $(x,y)$ on the graph of $y = f(x)$ and plot the point $(x,\frac{y}{2})$. Connect these new points to get the required graph.