(a) the graph of y = f(x) is shown. draw the graph of y = f(-x). (b) the graph of y = g(x) is shown. draw…
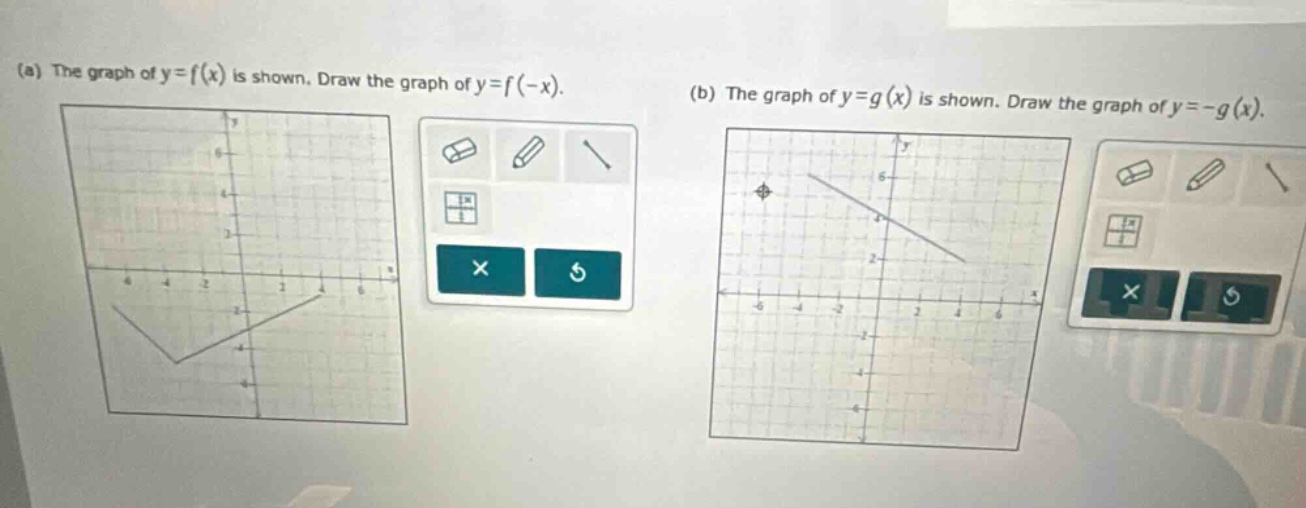
(a) the graph of y = f(x) is shown. draw the graph of y = f(-x). (b) the graph of y = g(x) is shown. draw the graph of y = -g(x).
Answer
Explanation:
Step1: Recall transformation rule for y = f(-x)
The graph of y = f(-x) is the reflection of y = f(x) about the y - axis. For every point (x, y) on y = f(x), the corresponding point on y = f(-x) is (-x, y).
Step2: Recall transformation rule for y=-g(x)
The graph of y = -g(x) is the reflection of y = g(x) about the x - axis. For every point (x, y) on y = g(x), the corresponding point on y=-g(x) is (x, -y).
To actually draw the graphs, one would take each key - point (such as x - intercepts, y - intercepts, and turning points) of the original graphs of y = f(x) and y = g(x) and apply the above - mentioned transformation rules to plot the new points and then connect them to form the new graphs.
Since this is a graph - drawing problem and the actual drawing cannot be presented in text form, the steps above describe the process of obtaining the new graphs.
Answer:
Follow the transformation rules: reflect y = f(x) about the y - axis to get y = f(-x) and reflect y = g(x) about the x - axis to get y=-g(x) and draw the new graphs accordingly.