the graph of y = f(x) is shown below. find all values of x for which f(x) > 0.
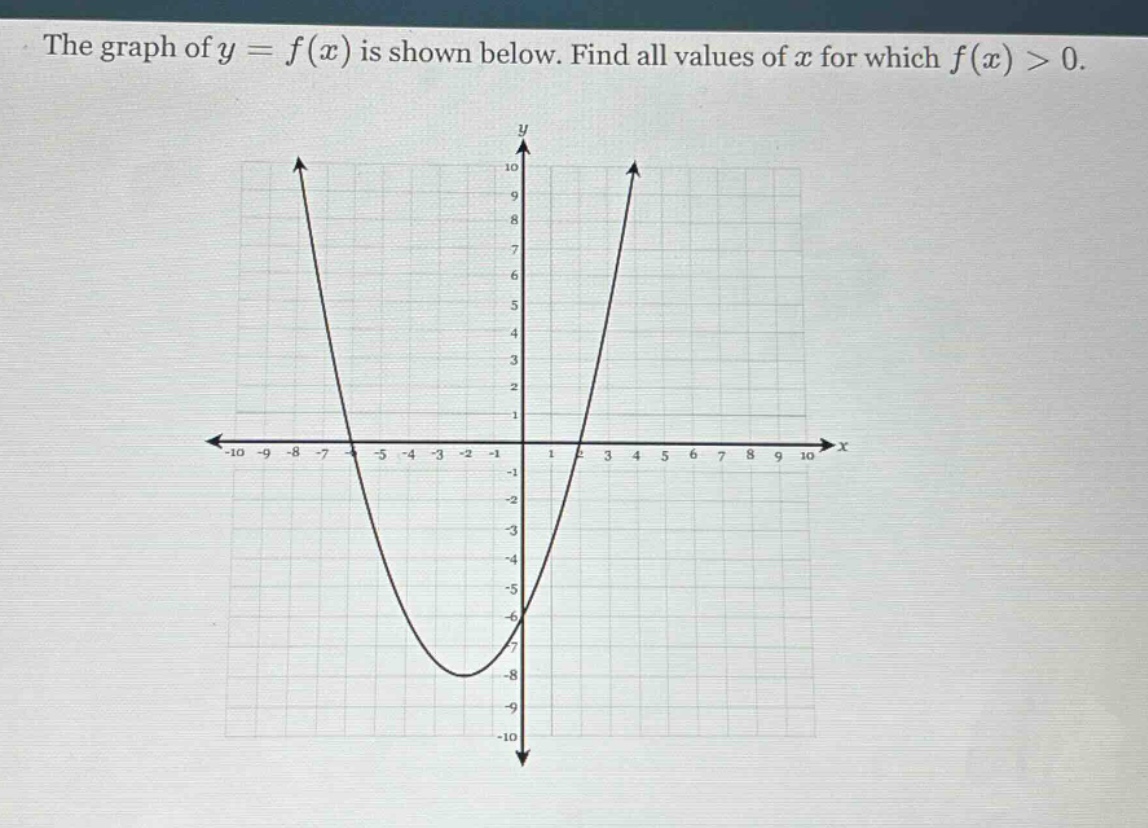
the graph of y = f(x) is shown below. find all values of x for which f(x) > 0.
Answer
Explanation:
Step1: Identify where graph is above x - axis
The graph of $y = f(x)$ is above the $x$-axis when $y>0$ (since $y = f(x)$). We look for the $x$-values where the curve is in the upper - half of the coordinate plane.
Step2: Determine the intervals
From the graph, we can see that the curve $y = f(x)$ is above the $x$-axis when $x < - 6$ and $x>1$.
Answer:
$x < - 6$ or $x>1$