the graph of $f(x)=2^{x}$ is shown on the grid. the graph of $g(x)=(\frac{1}{2})^{x}$ is the graph of…
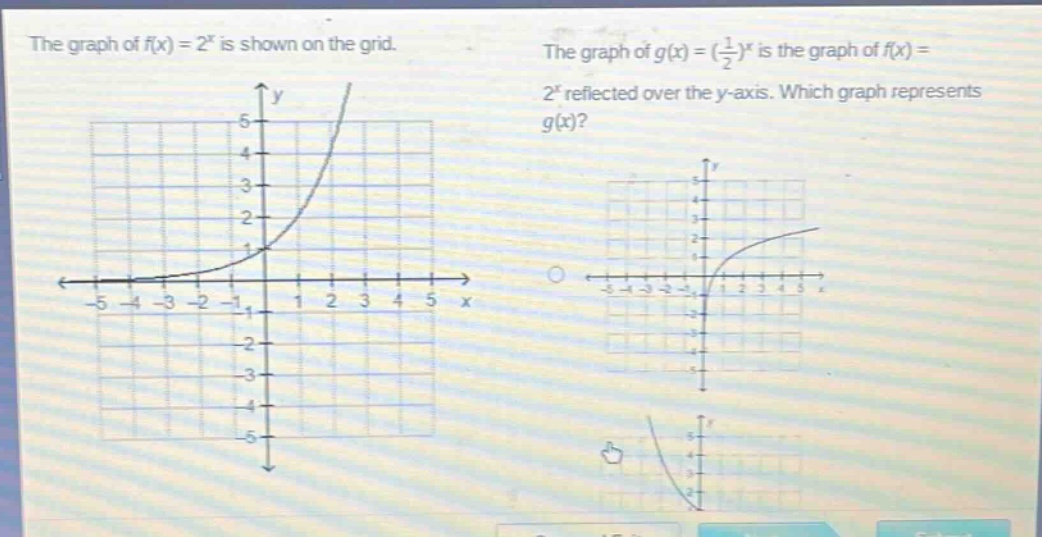
the graph of $f(x)=2^{x}$ is shown on the grid. the graph of $g(x)=(\frac{1}{2})^{x}$ is the graph of $f(x)=2^{x}$ reflected over the $y$-axis. which graph represents $g(x)$?
Answer
Explanation:
Step1: Recall reflection rule
When a function $y = f(x)$ is reflected over the $y$-axis, the transformation is $y=f(-x)$. Given $f(x)=2^{x}$ and $g(x)=(\frac{1}{2})^{x}=2^{-x}$, which is $f(-x)$.
Step2: Analyze key - points
For $f(x) = 2^{x}$, when $x = 0$, $y=1$; as $x\rightarrow+\infty$, $y\rightarrow+\infty$; as $x\rightarrow-\infty$, $y\rightarrow0$. For $g(x)=2^{-x}$, when $x = 0$, $y = 1$; as $x\rightarrow+\infty$, $y\rightarrow0$; as $x\rightarrow-\infty$, $y\rightarrow+\infty$. The graph of $g(x)$ will be a decreasing exponential function passing through the point $(0,1)$.
Answer:
The graph that is a decreasing exponential function passing through the point $(0,1)$ represents $g(x)$.