which graph shows a dilation?
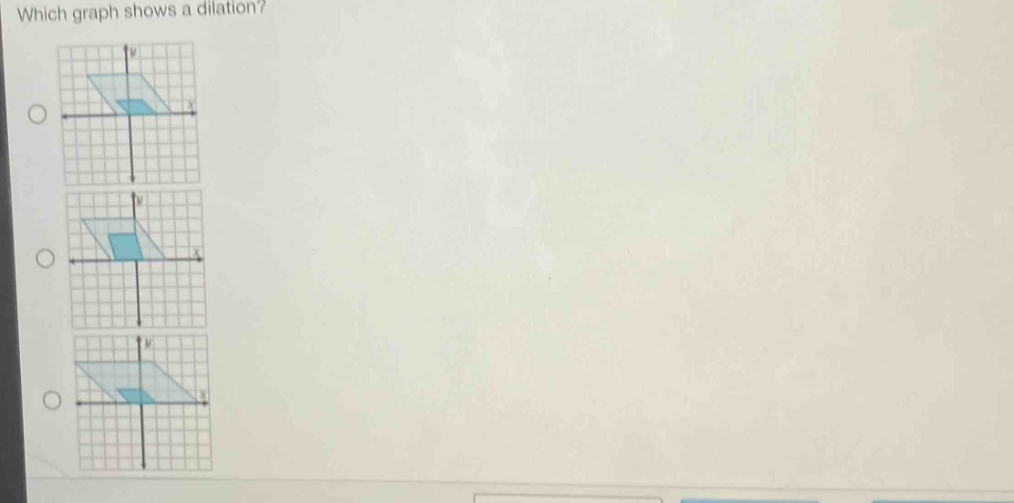
which graph shows a dilation?
Answer
Explanation:
Step1: Recall dilation definition
Dilation is a transformation that changes the size of a figure but not its shape. It stretches or shrinks the figure from a center - point. The corresponding angles of the original and dilated figures are equal, and the corresponding sides are proportional.
Step2: Analyze the graphs
In a dilation, the figure should be either larger or smaller than the original while having the same shape. The third graph shows a figure that is larger than the original shaded figure but has the same shape (same - angled parallelogram), which indicates a dilation.
Answer:
The third graph.