which graph shows direct variation?
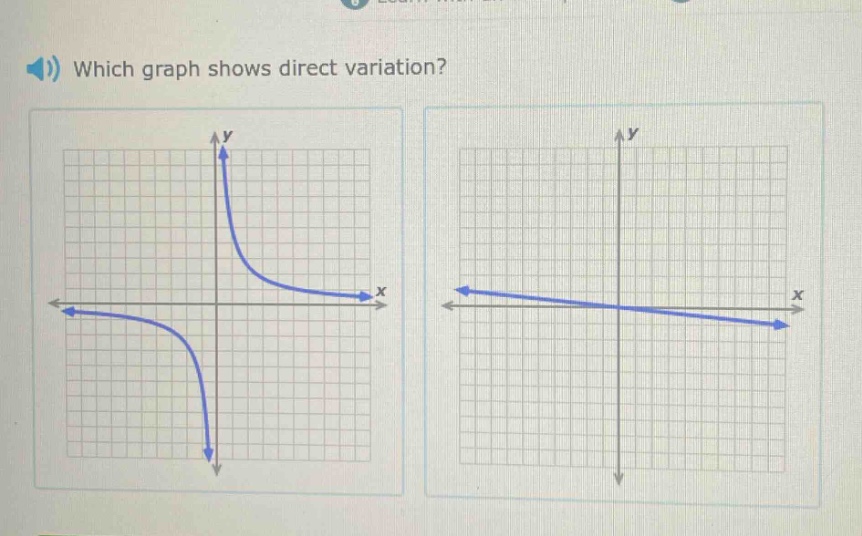
which graph shows direct variation?
Answer
Explanation:
Step1: Recall direct - variation formula
The equation for direct variation is $y = kx$, where $k$ is a non - zero constant. Its graph is a straight line passing through the origin $(0,0)$.
Step2: Analyze the first graph
The first graph is a hyperbola, which is the graph of an inverse - variation function ($y=\frac{k}{x}$), not a direct - variation function.
Step3: Analyze the second graph
The second graph is a straight line. If it passes through the origin, it represents a direct - variation. Assuming it passes through the origin (since no other information about non - origin intercepts is given), it is a direct - variation graph.
Answer:
The second graph.