6. the graph below shows the distance of three runners compared to the time during a race. which of the…
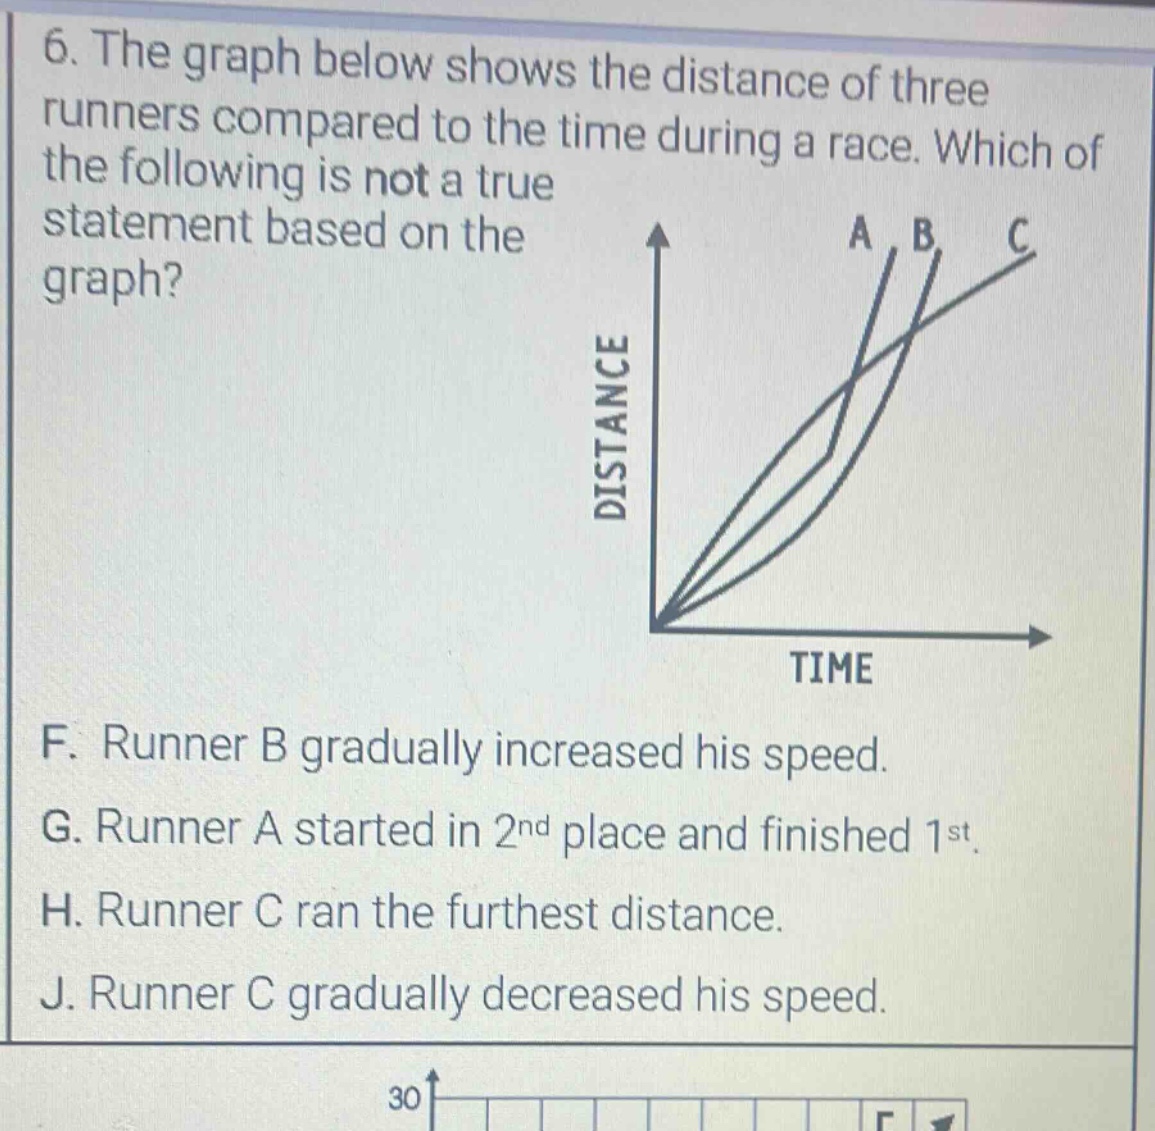
6. the graph below shows the distance of three runners compared to the time during a race. which of the following is not a true statement based on the graph? f. runner b gradually increased his speed. g. runner a started in 2nd place and finished 1st. h. runner c ran the furthest distance. j. runner c gradually decreased his speed.
Answer
Explanation:
Step1: Analyze speed - slope relationship
In a distance - time graph, the slope represents speed. A steeper slope means higher speed.
Step2: Evaluate Runner B
The slope of Runner B's graph is getting steeper over time, so Runner B is gradually increasing speed. So, statement F is true.
Step3: Evaluate Runner A
At the start (time = 0), Runner A is behind Runner B and Runner C (second - closest to the origin on the distance - axis). At the end, Runner A is ahead of the others. So, Runner A started in 2nd place and finished 1st. Statement G is true.
Step4: Evaluate Runner C
At the end of the race (highest time value on the graph), Runner A has run the furthest distance, not Runner C. So, statement H is false.
Step5: Evaluate Runner C's speed
The slope of Runner C's graph is getting less steep over time, so Runner C is gradually decreasing speed. Statement J is true.
Answer:
H. Runner C ran the furthest distance.