which graph shows the equation c = 10+ 3t, where c is the total cost of going to the carnival and t is the…
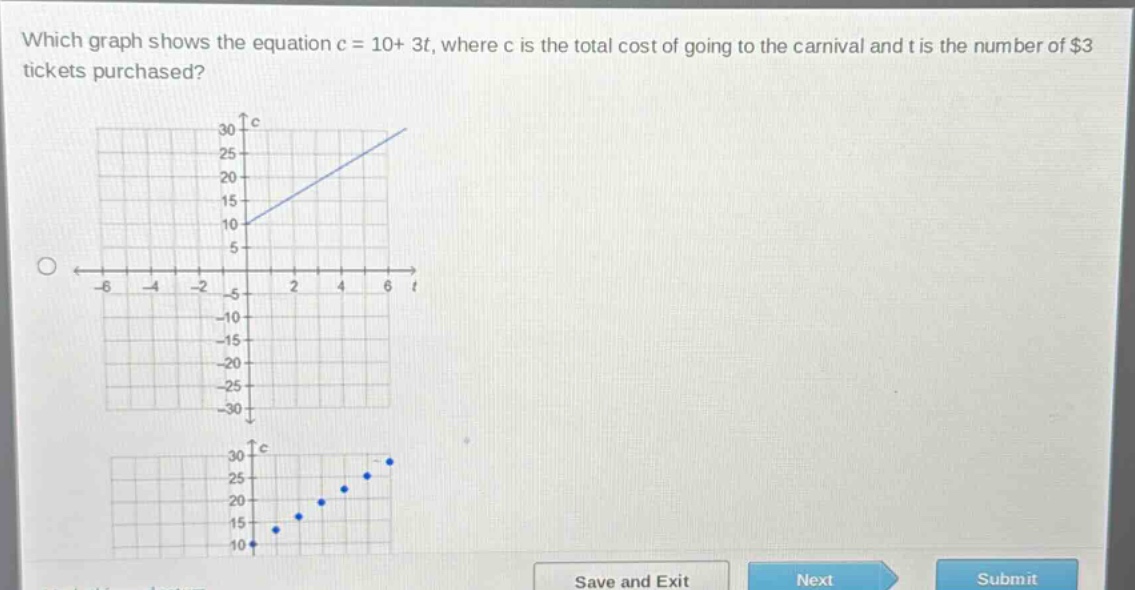
which graph shows the equation c = 10+ 3t, where c is the total cost of going to the carnival and t is the number of $3 tickets purchased?
Answer
Explanation:
Step1: Identify the form of the equation
The equation $c = 10+3t$ is in the slope - intercept form $y = mx + b$, where $m = 3$ (the slope) and $b = 10$ (the y - intercept). Here $c$ is like $y$ and $t$ is like $x$.
Step2: Analyze the y - intercept
When $t = 0$, $c=10 + 3\times0=10$. So the graph should cross the $c$ - axis at the point $(0,10)$.
Step3: Analyze the slope
The slope $m = 3=\frac{\Delta c}{\Delta t}$, which means for every increase of 1 in $t$, $c$ increases by 3.
Answer:
The graph that has a $c$ - intercept of 10 (crosses the $c$ - axis at 10) and has a positive slope of 3 (rises 3 units for every 1 unit increase in $t$) is the correct one. Without seeing all the options, based on the above - mentioned characteristics, the graph that starts at the point $(0,10)$ and has a positive slope is the answer. If the first graph starts at $(0,10)$ and is a straight line with a positive slope, it is the correct graph.