which graph shows the equation v = 4 + 2t, where v is the total volume of water in a bucket and t is the…
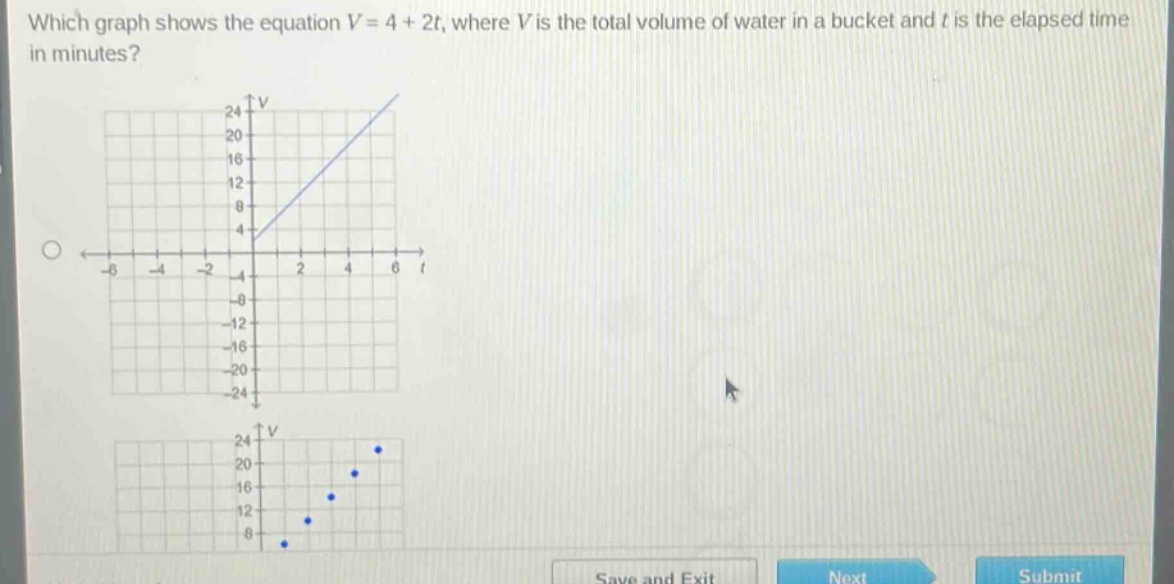
which graph shows the equation v = 4 + 2t, where v is the total volume of water in a bucket and t is the elapsed time in minutes?
Answer
Answer: The first graph (the one with a straight - line)
Explanation:
Step1: Identify the equation type
The equation $V = 4+2t$ is a linear equation in the form $y = mx + b$, where $m = 2$ (the slope) and $b = 4$ (the y - intercept).
Step2: Analyze linear graph features
A linear equation represents a straight - line graph. The y - intercept is the value of $V$ when $t = 0$. Substituting $t = 0$ into $V = 4+2t$, we get $V=4$. The slope of 2 means that for every increase of 1 in $t$, $V$ increases by 2. The first graph is a straight - line with a $V$ - intercept of 4 and a positive slope, which matches the characteristics of the equation $V = 4+2t$. The second graph with discrete points does not represent a continuous linear relationship described by the given equation.