which graph shows a function that always has a negative average rate of change?
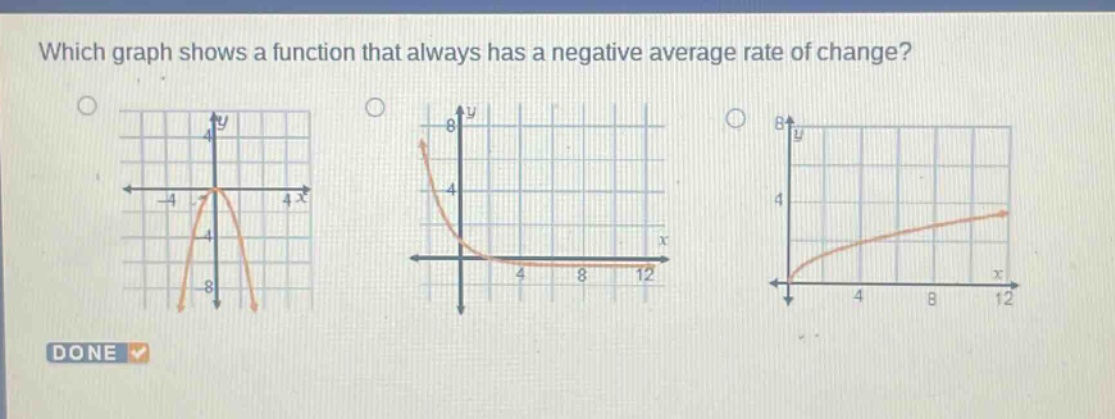
which graph shows a function that always has a negative average rate of change?
Answer
Explanation:
Step1: Recall average - rate - of - change formula
The average rate of change of a function $y = f(x)$ over the interval $[x_1,x_2]$ is $\frac{f(x_2)-f(x_1)}{x_2 - x_1}$. A negative average rate of change means that as $x$ increases ($x_2>x_1$), $f(x_2)<f(x_1)$, i.e., the function is decreasing.
Step2: Analyze each graph
For the first graph (a parabola opening down - ward), it is increasing on some intervals and decreasing on others. For the second graph, as $x$ increases, the $y$ - values of the function are always decreasing. For the third graph, as $x$ increases, the $y$ - values of the function are increasing.
Answer:
The second graph.