the graph shows the linear relationship between the height of a plant (in centimeters) and the time (in…
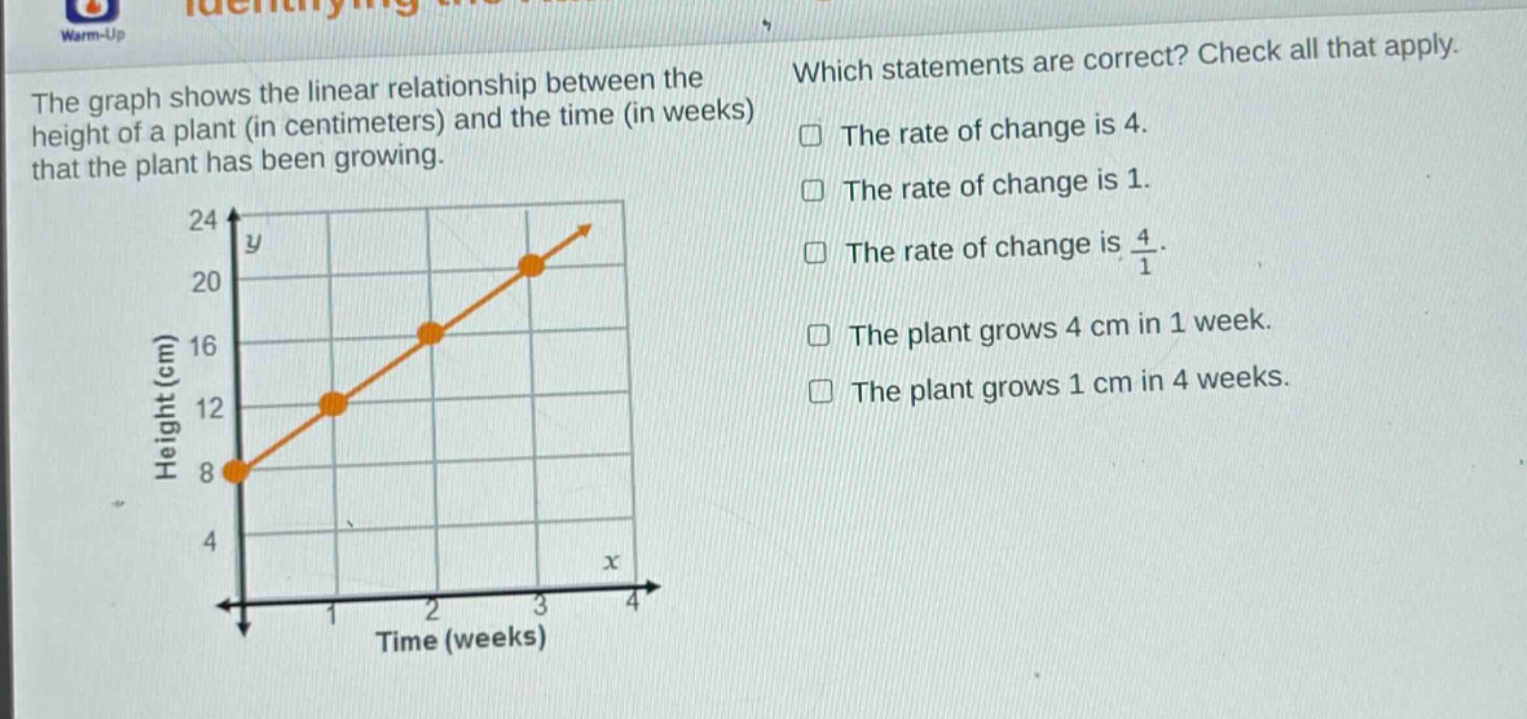
the graph shows the linear relationship between the height of a plant (in centimeters) and the time (in weeks) that the plant has been growing. which statements are correct? check all that apply. the rate of change is 4. the rate of change is 1. the rate of change is $\frac{4}{1}$. the plant grows 4 cm in 1 week. the plant grows 1 cm in 4 weeks.
Answer
Explanation:
Step1: Recall rate - of - change formula
The rate of change (slope) of a linear relationship is given by $m=\frac{y_2 - y_1}{x_2 - x_1}$. Let's take two points from the graph, say $(0,8)$ and $(1,12)$.
Step2: Calculate the rate of change
$m=\frac{12 - 8}{1-0}=\frac{4}{1}=4$. This means the plant's height increases by 4 cm for every 1 - week increase in time.
Answer:
The rate of change is 4. The rate of change is $\frac{4}{1}$. The plant grows 4 cm in 1 week.