which graph shows the logarithmic function $f(x)=log_{0.5}x$?
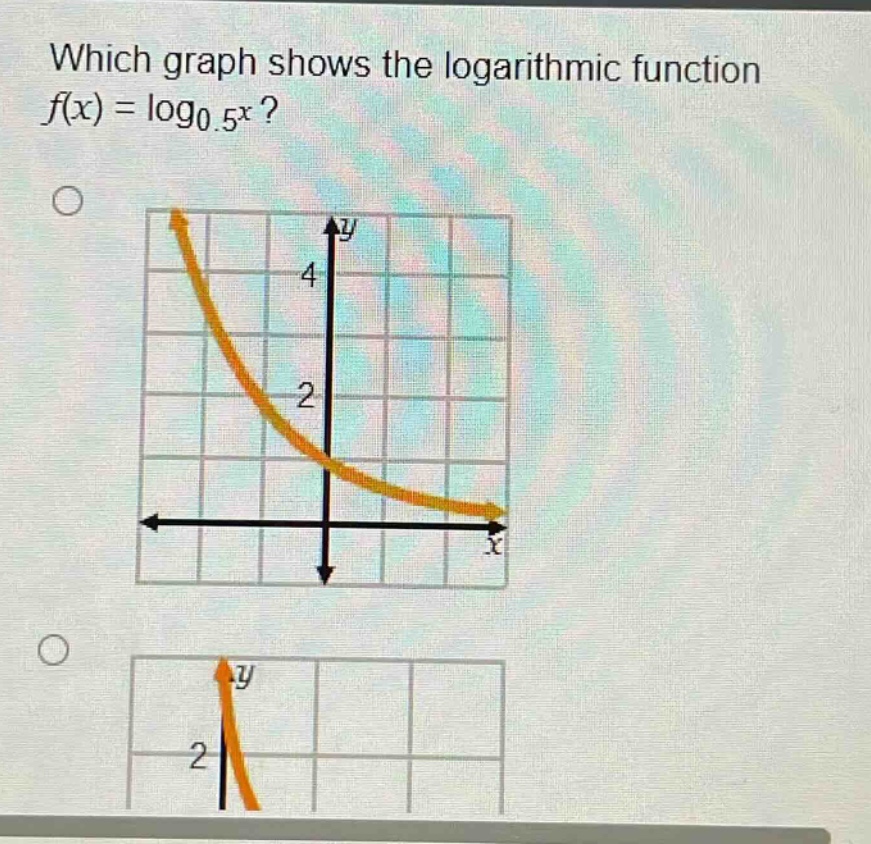
which graph shows the logarithmic function $f(x)=log_{0.5}x$?
Answer
Explanation:
Step 1: Analyze the base of the logarithm
The base ( 0.5 ) is between ( 0 ) and ( 1 ), so the logarithmic function is decreasing.
Step 2: Identify key points and domain
The function ( \log_{0.5} x ) passes through ( (1, 0) ) and has a domain ( x > 0 ). A decreasing curve through ( (1, 0) ) with ( x > 0 ) matches the first graph.
Answer:
The first graph (description matches a decreasing logarithmic curve passing through ( (1, 0) ) with domain ( x > 0 )).