the graph shows the relationship between distance driven and gallons of gas used. use the graph to complete…
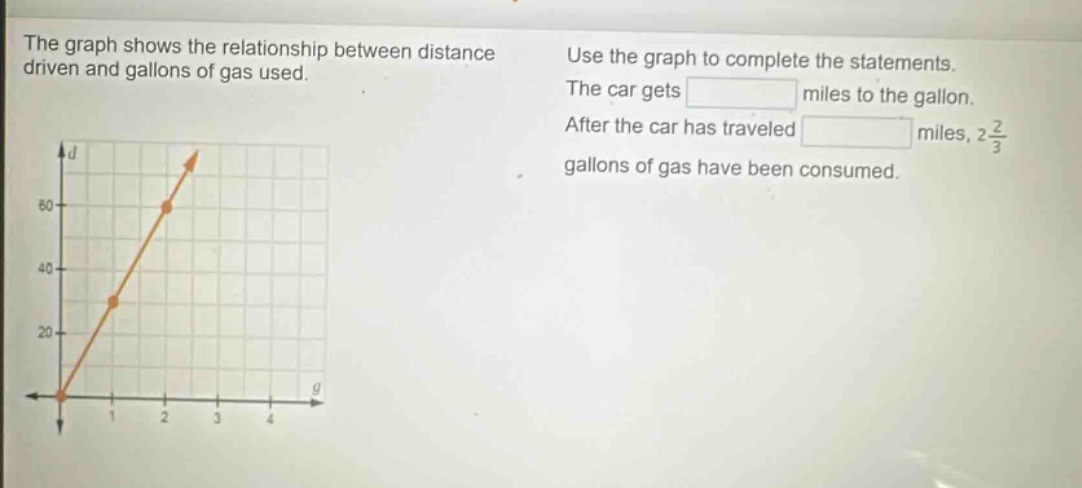
the graph shows the relationship between distance driven and gallons of gas used. use the graph to complete the statements. the car gets miles to the gallon. after the car has traveled miles, 2\\frac{2}{3} gallons of gas have been consumed.
Answer
Explanation:
Step1: Find miles - per - gallon
The graph is a straight - line passing through the origin $(0,0)$. The slope of the line represents the miles per gallon. We can use two points on the line, say $(1,30)$ and $(0,0)$. The slope formula is $m=\frac{y_2 - y_1}{x_2 - x_1}$. Here, $y$ represents distance $d$ and $x$ represents gallons of gas $g$. So, $m=\frac{30 - 0}{1 - 0}=30$. The car gets 30 miles to the gallon.
Step2: Find distance for $2\frac{2}{3}$ gallons
We know the rate of miles per gallon is 30. To find the distance $d$ when the number of gallons $g = 2\frac{2}{3}=\frac{8}{3}$, we use the formula $d=mg$. Substitute $m = 30$ and $g=\frac{8}{3}$ into the formula: $d=30\times\frac{8}{3}=80$.
Answer:
The car gets 30 miles to the gallon. After the car has traveled 80 miles, $2\frac{2}{3}$ gallons of gas have been consumed.