the graph shows the relationship between distance driven and gallons of gas used. use the graph to complete…
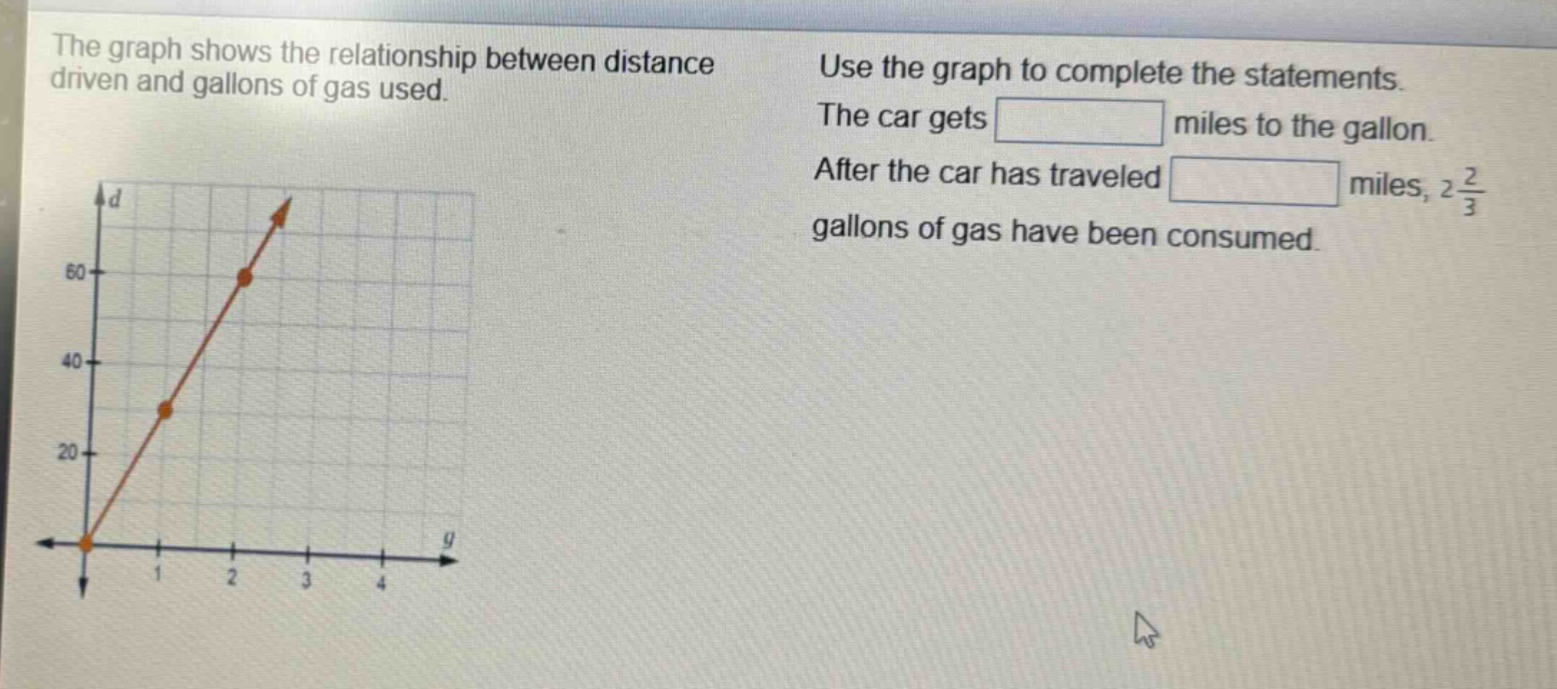
the graph shows the relationship between distance driven and gallons of gas used. use the graph to complete the statements. the car gets miles to the gallon. after the car has traveled miles, 2 2/3 gallons of gas have been consumed.
Answer
Explanation:
Step1: Encontrar la eficiencia del automóvil
La eficiencia (miles por galón) es la pendiente de la línea. Si observamos que cuando $g = 2$, $d=60$. La pendiente $m=\frac{d}{g}$. Entonces $m=\frac{60}{2}=30$.
Step2: Encontrar la distancia recorrida
Sabemos que la relación es $d = 30g$. Dado $g = 2\frac{2}{3}=\frac{8}{3}$, entonces $d=30\times\frac{8}{3}=80$.
Answer:
The car gets 30 miles to the gallon. After the car has traveled 80 miles, $2\frac{2}{3}$ gallons of gas have been consumed.